.png)
Key Takeaways
- Around 80% is a solid first target for positive-response CSAT. Comparable peers give that number its meaning.
- A CSAT score of around 80% is considered a solid first target. What is considered a good score varies by industry.
- A CSAT benchmark comes with a scoring method and a customer group. Both need to match the result you’re judging.
- Response volume and the makeup of accounts contributing feedback affect how confidently you can interpret a score.
- A useful target connects your recent results to a specific service change and a review date.
- Use the score pattern to choose the first check. Customer comments and service records guide the next action.
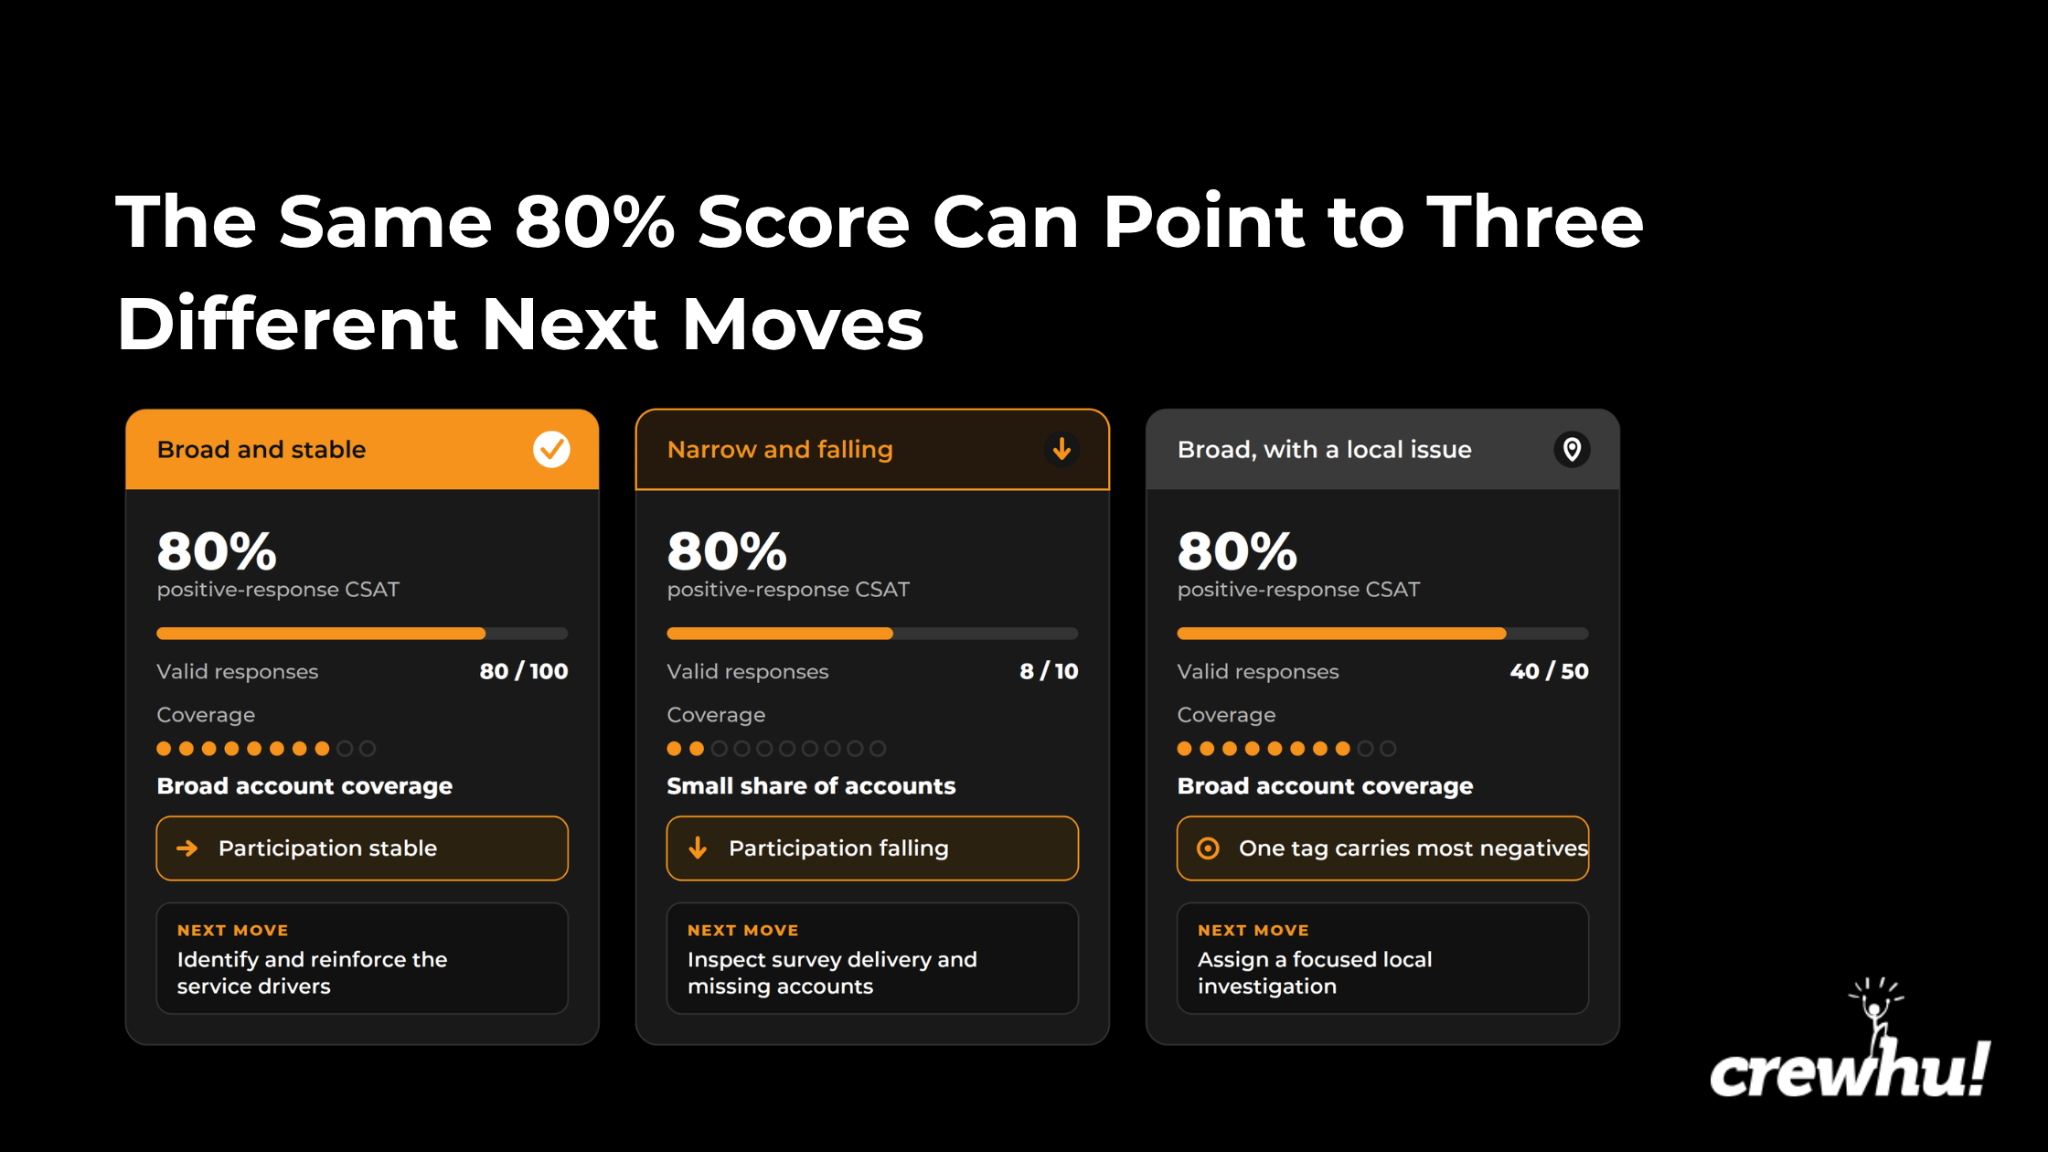
Imagine two support teams report 80% CSAT. One has 200 recent replies spread across most client accounts, while the other has 10 replies from a small group of regular respondents, and participation has been falling for three months.
Put those scores in a service review, and the conversation takes different turns. The first team can look for service patterns across a wider group of accounts. The second starts with survey delivery and the accounts it isn’t hearing from. CSAT score encompasses more than just the percentage. For it to be truly useful, teams need to look closely at what’s behind it.
What’s a good CSAT score?
Around 80% is a reasonable starting point for a good CSAT score. An 85% result is strong, and 90% or higher sits near the top of a comparable peer group. Your scoring method, support channel, and own trend determine how useful that comparison is.
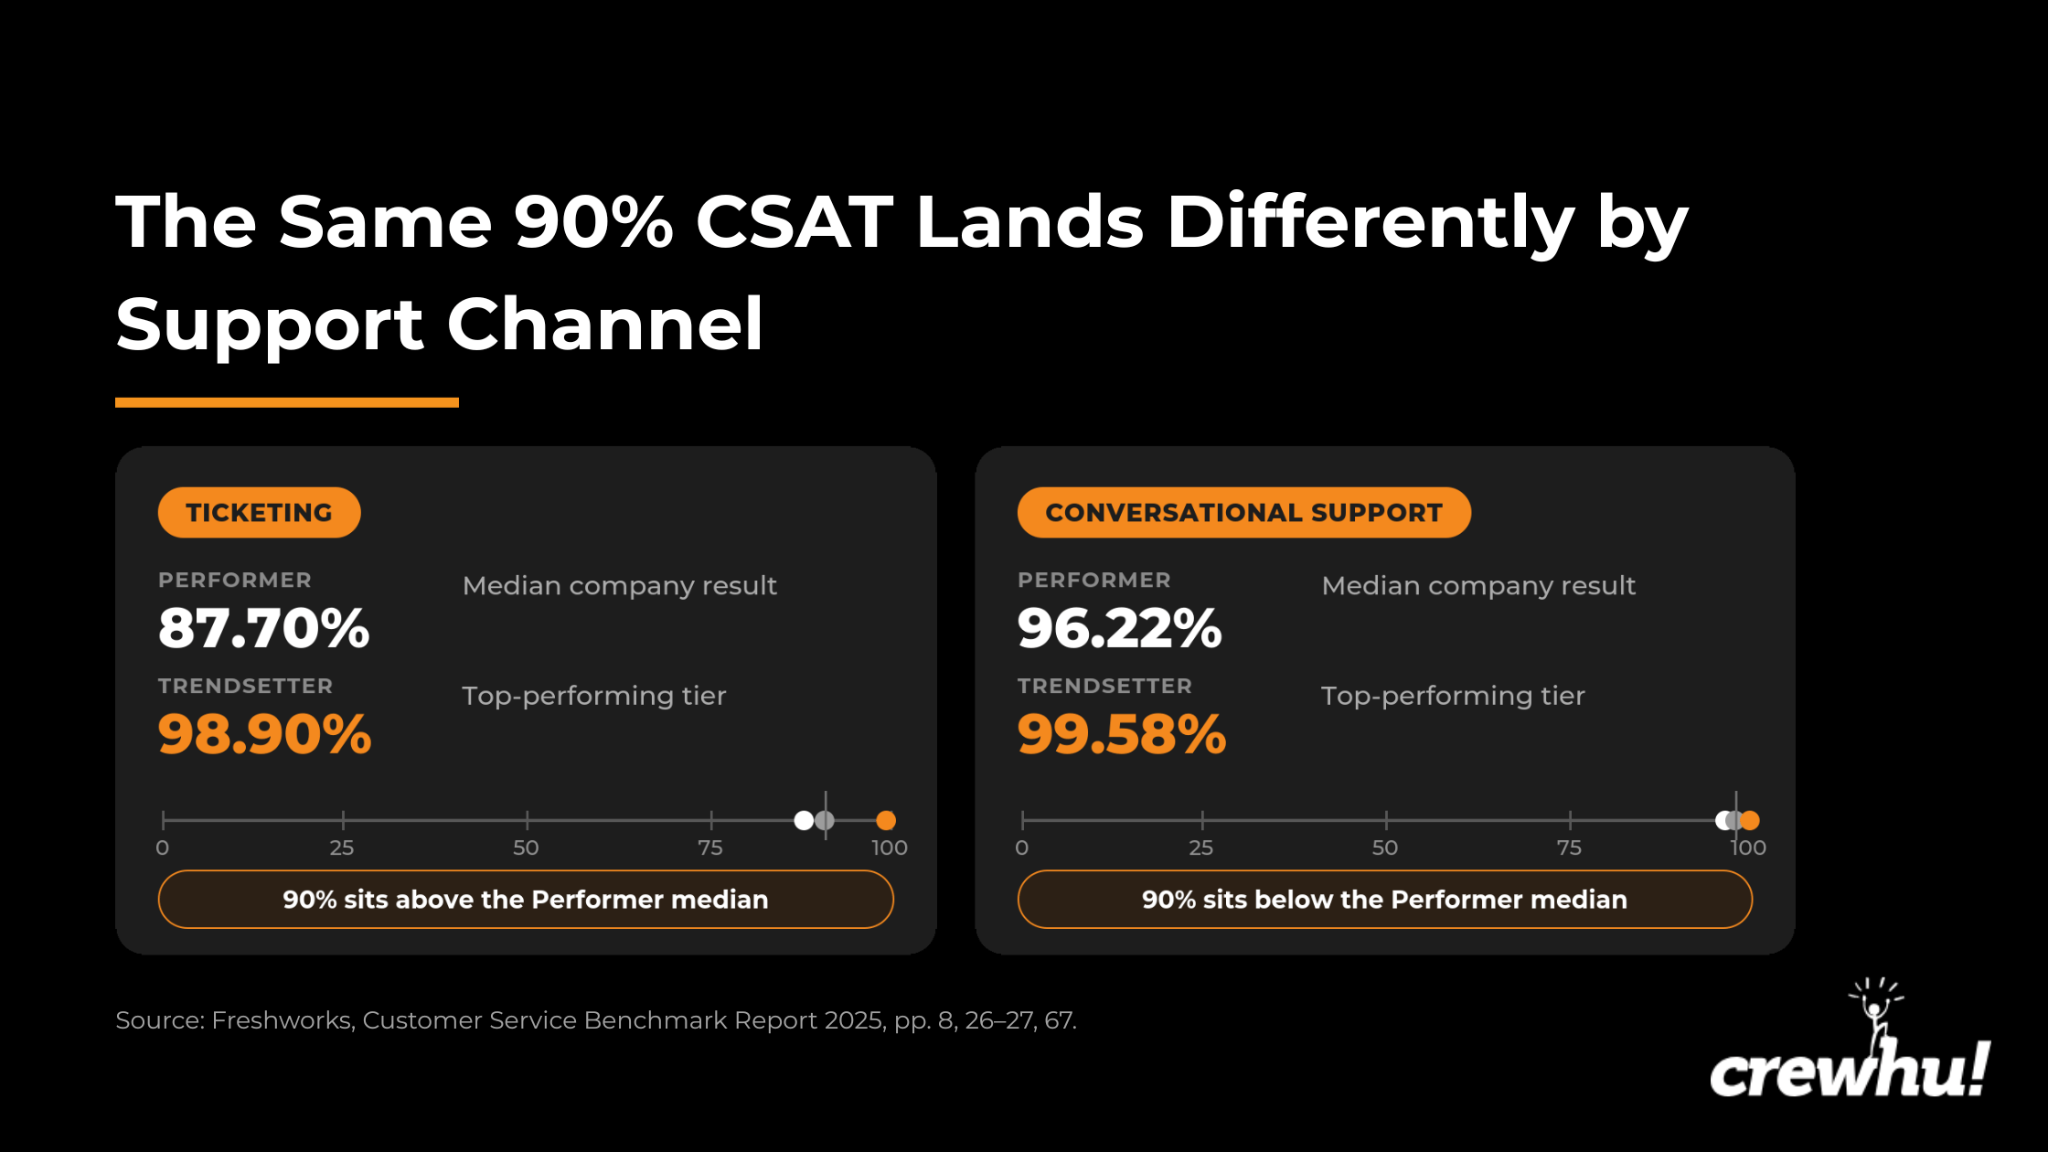
A 90% target would put a ticketing team above the median company result according to Freshworks. For conversational support though, that target would fall below the median. Match the support group before deciding how ambitious 90% really is.
Compare the same kind of CSAT score before using a benchmark
Two teams can report the same CSAT percentage while counting different ratings as positive. Check their calculation rules and the experiences customers were asked to rate before comparing performance.
Check what the score counts
Suppose 100 customers rate a service interaction on the same five-point survey, with 5 as the most positive answer. Fifty choose 5, 30 choose 4, 10 choose 3, and 10 choose 2. Those replies produce three different results.
|
What you report |
Calculation |
Result |
|
Top-two-box CSAT |
Ratings of 4 or 5: 80 ÷ 100 |
80% |
|
Top-box CSAT |
Ratings of 5: 50 ÷ 100 |
50% |
|
Average rating |
420 rating points ÷ 100 |
4.2 out of 5 |
According to SQM, “world class” means 85% of respondents chose the “Very satisfied” response. So, an 85% target on that top-box measure asks 85 out of every 100 respondents to choose the most positive answer available.
Crewhu’s dashboard score subtracts the share of bad ratings from the share of good ratings, while okay remains neutral. For example:
- 80% Good, 20% Okay, 0% Bad → score 80
- 90% Good, 0% Okay, 10% Bad → score 80
- 80% Good, 0% Okay, 20% Bad → score 60
The first two percentage groupings produce the same score. The second grouping gives the team negative responses to follow up on, and in the third, replacing the neutral responses with negative ones pulls the score down to 60. Read the rating mix alongside the number and compare Crewhu results with earlier scores calculated using the same formula.
Keep the survey setup consistent
A post-ticket survey, a recent-contact survey, and a relationship survey capture different experiences. Name the event or relationship each score covers before using it as a benchmark.
For instance, Ofgem reported 77% customer service satisfaction among energy bill payers in the UK. But if you restrict the result to those who’d contacted their supplier in the previous three months, it jumps to 81%. A pooled percentage combines all survey replies. A median account score summarizes the middle of the account-level results. Record which calculation the benchmark uses.
When you change survey tools or calculation rules, mark the change in your trend report and keep the old and new definitions alongside the scores.
Ask five questions before using a peer benchmark:
- Which ratings count as positive?
- When is the survey sent, and what experience are customers rating?
- Are the customers and issues similar to yours?
- How are individual responses combined into the reported score?
- Do the results cover comparable periods?
How much weight should you put on your CSAT score?
What does 100% CSAT tell you?
A score of 100% means every valid response met the positive threshold. Twelve positive responses out of 12 and 1,200 out of 1,200 both produce 100%. However, the second result rests on much more observed feedback:
- Who’s answering your CSAT surveys?
- How many valid replies did you receive?
- What share of survey invitations received a valid reply? That’s your response rate.
- Which active accounts replied, and how are responses spread across them? Mark an account as present when it contributed at least one reply during the period.
An account with a single reply and one with 50 both count as accounts you’ve heard from. In a score that pools every response though, the second account has far more say.
Technician-level results especially need a closer look. COPC notes that contact-center agents often receive only 15–25 CSAT responses a month, which can easily skew results.
Before following up with an account that hasn’t replied, check if it even received a survey. With post-ticket CSAT, an account with no recent tickets may have had no survey to answer.
One rating, five points
With 20 responses, 18 positive ratings give you 90% CSAT. Seventeen give you 85%. One rating separates those results.
Read the interactions and rolling trends before choosing a coaching topic. Was the answer complete? Did the customer know what would happen next?
 When CSAT moves, follow the ticket trail
To investigate what changed, segment the result by account, team, technician, ticket type, touch point, or service tag, then open the comments and ticket history for the affected segment.
Suppose a customer leaves a low rating and comes back with the same question after the ticket closes. Was something missing from the answer, or is the product still difficult to use?
Support Operations Consultant Meghan Gallagher of MG Consulting draws this distinction on “Happy to Help” with host Priscilla Brooke. She argues against using CSAT to evaluate support performance. Her recommendation? Tracking how often customers return after an issue seems resolved and how many exchanges it takes to settle it.
Open the original exchange and follow two lines of inquiry:
- Did the original answer leave a gap? Review the missing step or unclear instruction with the support team.
- Does the question keep returning across customers? Group the cases by feature and review them with the product team.
How to set a realistic CSAT target
Build a reliable internal baseline
Plot monthly CSAT beside the number of replies, response rate, and accounts represented. Start with the company-wide trend, then zoom in on the service or account your target will cover, keeping the survey setup consistent.
When an account or technician receives few survey responses, use a longer rolling view. Keep the latest month alongside it so you can investigate sudden problems without resetting the target at every fluctuation.
A company-wide target also needs an account-by-account check. A pooled score of 79% can combine several accounts above 90% with a result below 60% from an account that supplies many of the replies. The next improvement step may lie in a general service process, one client relationship, or a narrow interaction type.
Your baseline sets the starting point. Comparable peers help you judge the size of the next step.
Tie the target to one service change
Imagine a ticket moves from the project team to the help desk. The customer is then left waiting for an update. Handoff-ticket CSAT has stayed between 77% and 80% for 10 months, with a median of 79%. The team receives about 100 valid replies a month, and roughly 10 neutral or negative ratings mention the missing update. Survey participation and the mix of responding accounts have stayed steady.
After analyzing the data, the service lead sets aside time for both teams to check ownership and send an update at every transfer. Each handoff gets a named owner and a recorded customer update.
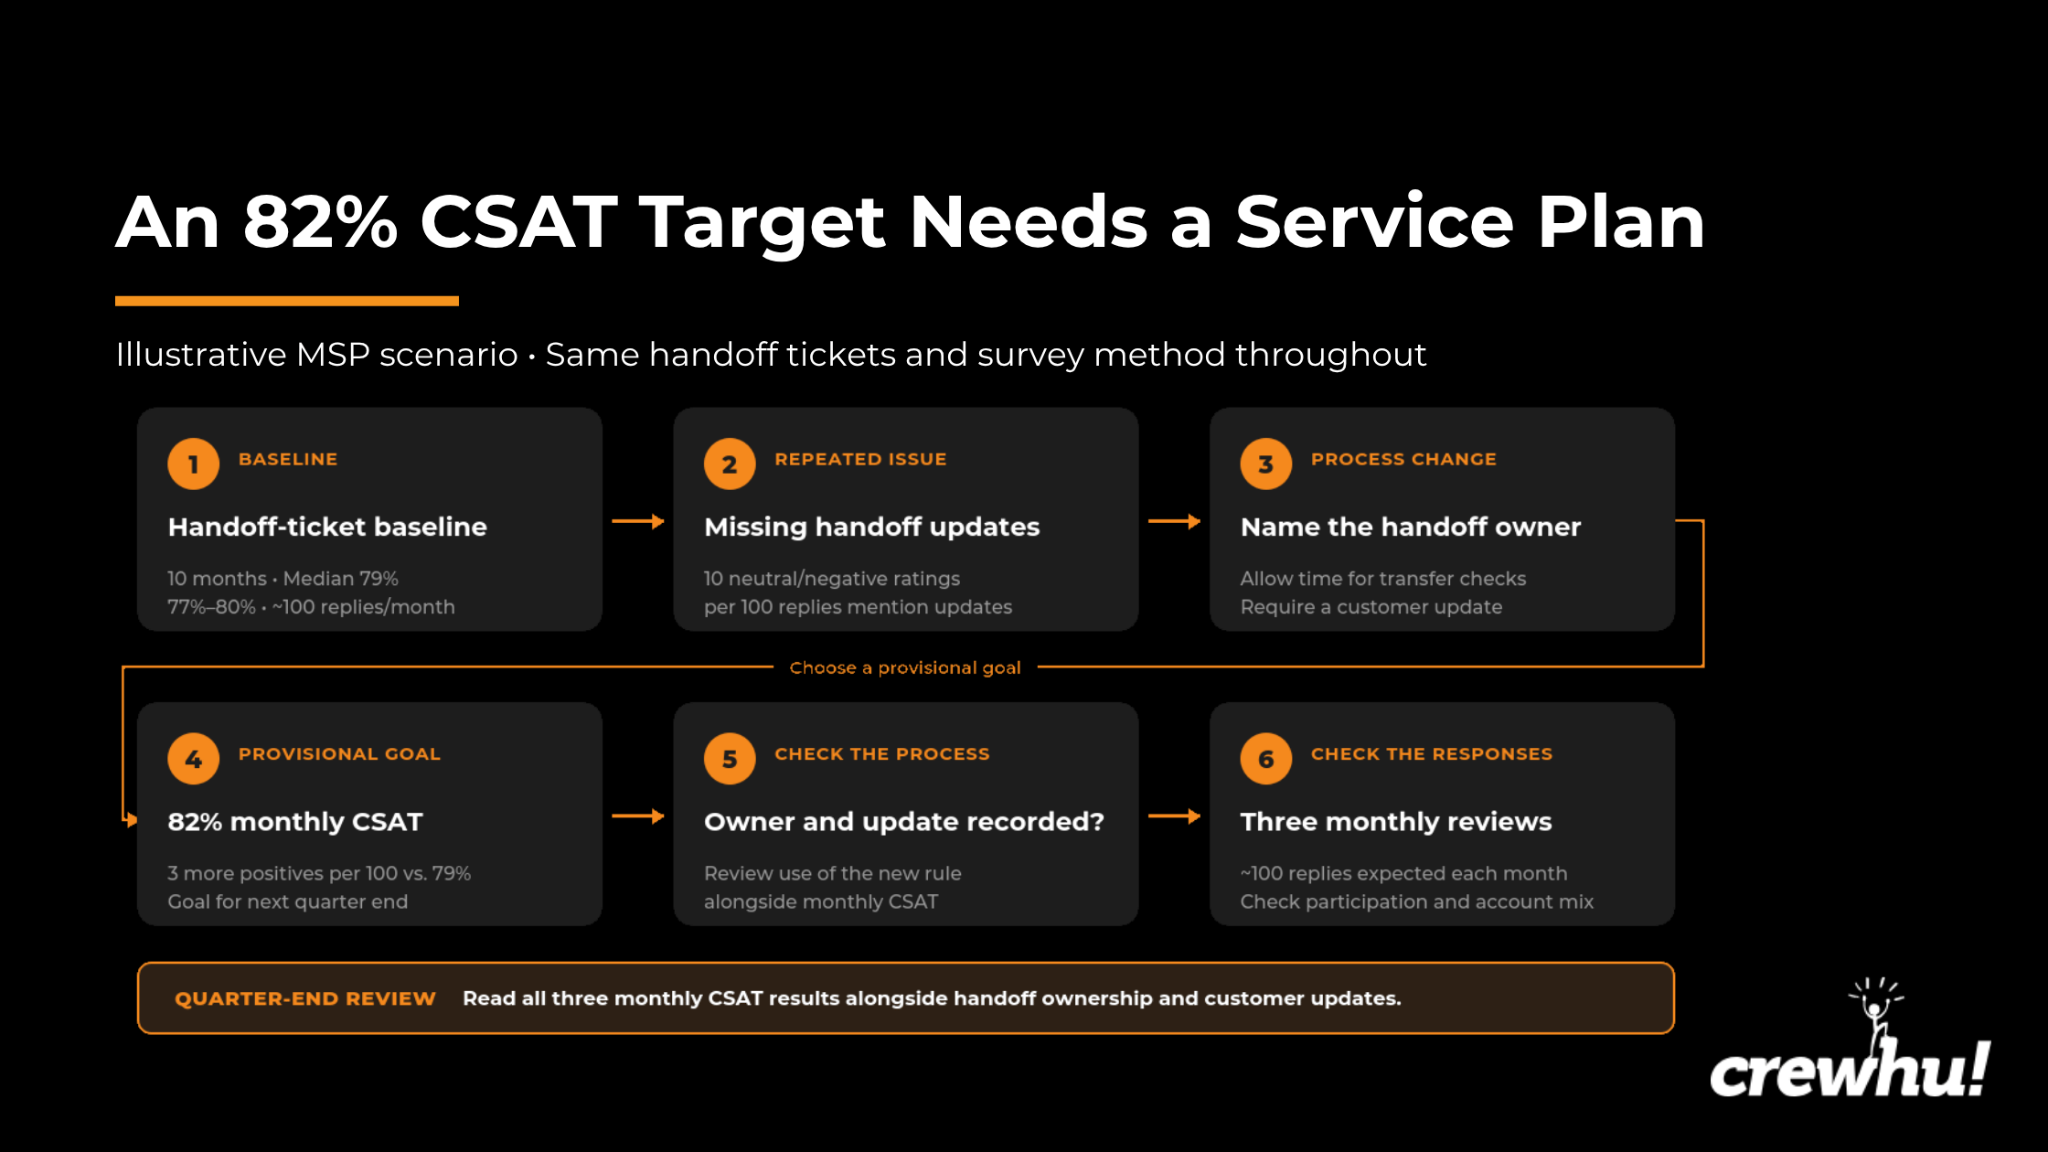 The team chooses 82% as a provisional, quarter-end goal for monthly CSAT on those same handoff tickets. That’s two points above the previous high, and at 100 responses, it means three more positive ratings than the 79% month.
Plan three monthly reviews, with roughly 100 responses expected in each. Track CSAT alongside the share of handoffs with a recorded owner and update. Check response rate, the mix of responding accounts, reopen rate, and resolution time too.
At quarter end, read all three results alongside use of the new routine. A rising score with patchy adoption calls for a closer look at the tickets before the team credits the change. Sparse replies or a late rollout may require more observation.
What your CSAT pattern should trigger next
|
What you see |
Check first |
Cause and effect |
|
High and steady across most active accounts |
Participation, responding accounts, and results by segment |
If praise is consistent across accounts and periods, identify what customers value and recognize the people doing it well. |
|
High score with fewer replies or responding accounts |
Invitations sent, survey delivery, and replies by account |
If invitations were missed, fix delivery. If participation fell, check why fewer customers replied before reassessing the trend. |
|
Different results by account, team, or ticket type |
Comments and ticket histories in the lower-scoring segment |
If similar complaints cluster in that segment, give the relevant service lead those cases to investigate. |
|
A sharp swing from a few responses |
The changed ratings and their underlying interactions |
If one or two ratings explain the swing, review those cases now and use a longer trend to assess performance. |
|
A sustained decline or repeated negative theme |
Similar comments and comparable service cases |
If the same problem recurs, agree on a process change, name its owner, and set a review date. |
Make the next step explicit:
- Name the owner.
- Identify the evidence to review.
- Set the review date.
The owner might be an account manager, service desk lead, technician manager, or process owner. For recurring issues, record the tag, account group, and ticket type. Then use those details to find the relevant cases again at the next review. Keep the review date tied to the next comparable score period as well.
Close the customer feedback loop by updating the customer and checking that the fix held. Bring recurring issues into the next service review to decide which changes belong in the standard process.
See the service behind your CSAT score with Crewhu
Crewhu can pull back the curtains on CSAT and expose the data for clear next steps. For those project-to-help-desk transfers, review the Communication-tagged feedback in Pulse. Compare the score and rating mix for the affected accounts, then open the surveys behind the change. With the ConnectWise integration in place, follow the feedback to the linked tickets and check whether the promised updates were sent.
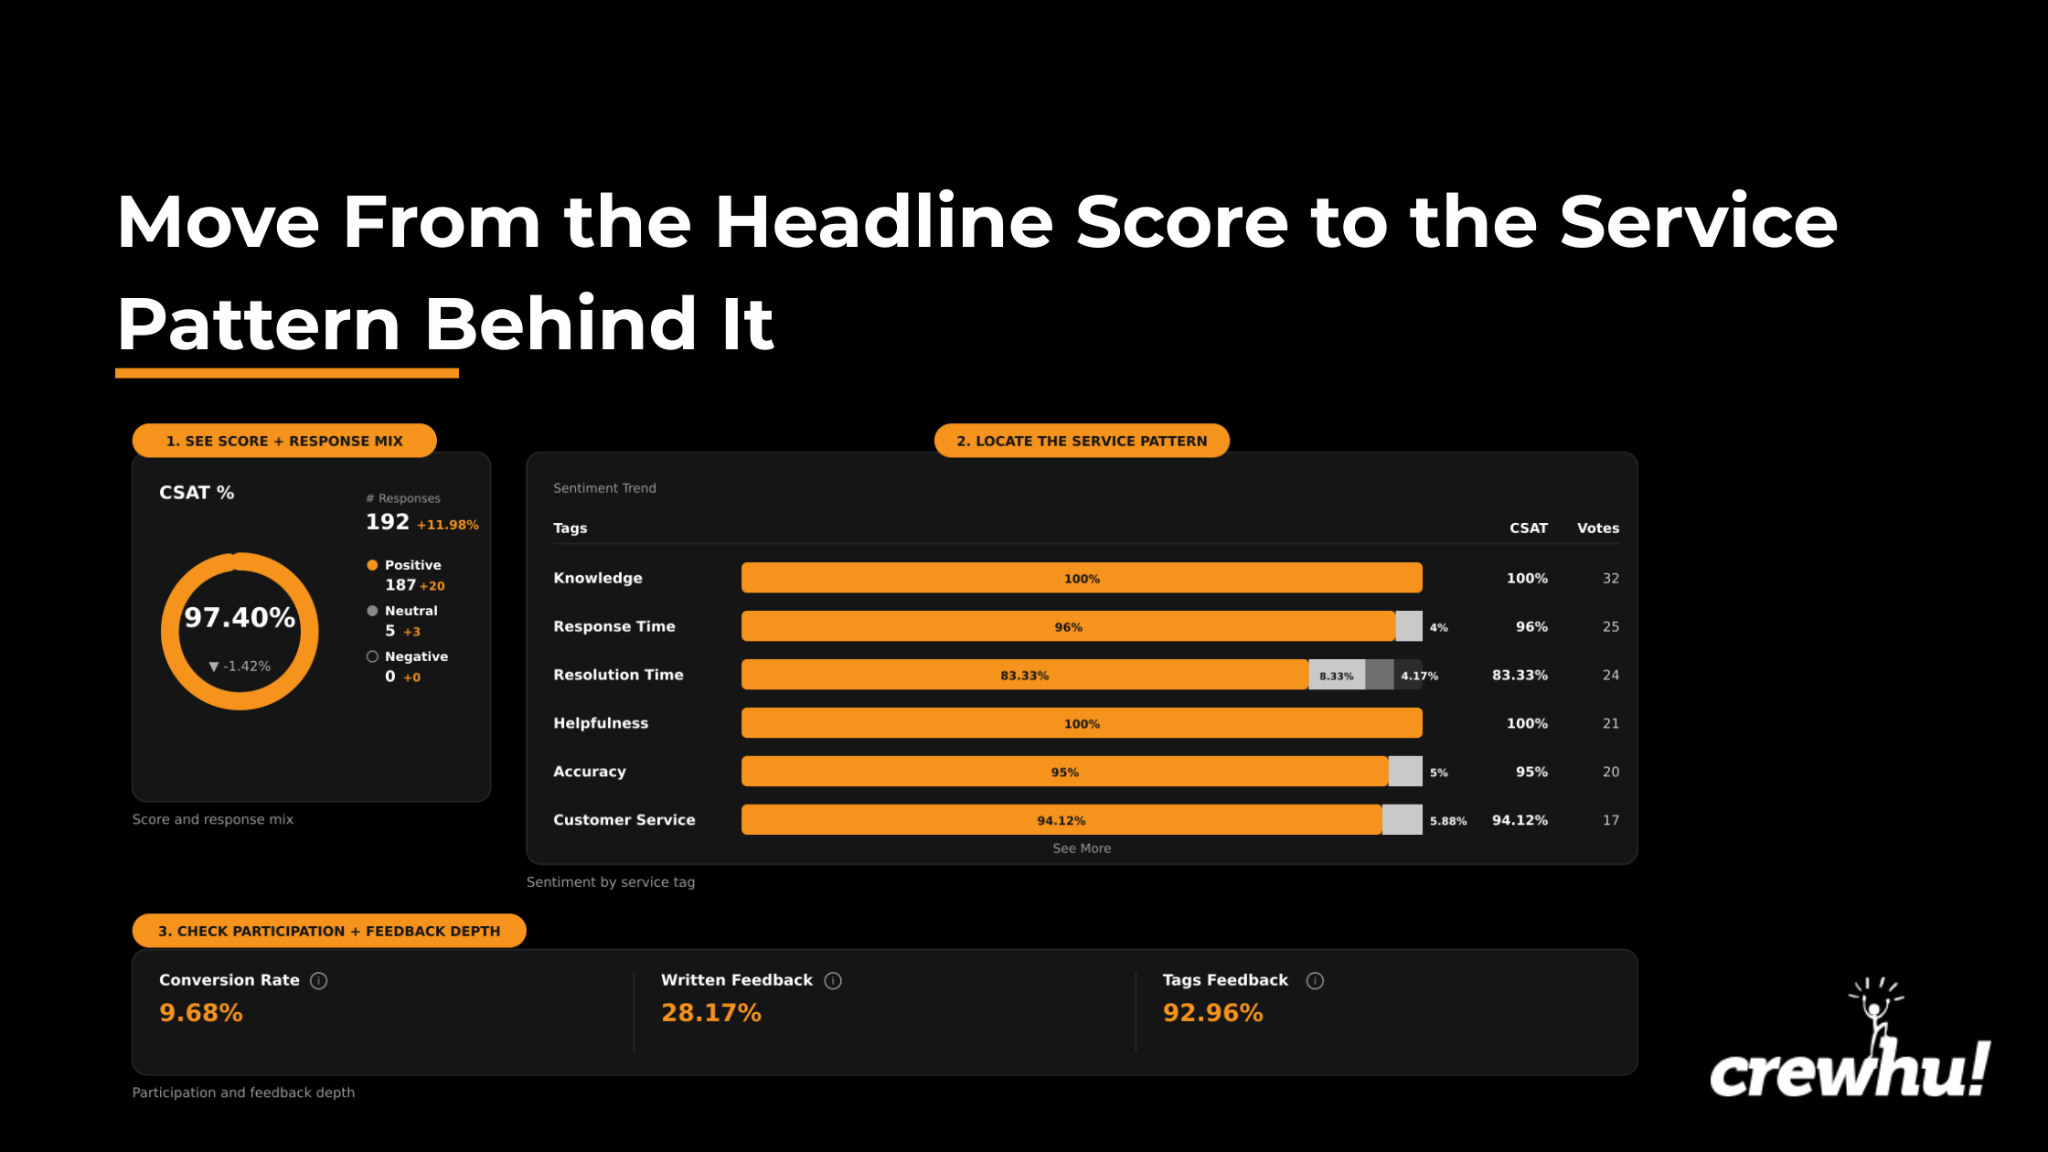 Then ask the account owner to review those transfers with the service team. The owner follows up with the customer to understand what was missing and explain the next step.
When a customer praises a technician’s clear explanation, bring that comment into the team review. Show colleagues what earned the praise and recognize the person who did the work. Setting up a Crewhu contest can count positive ratings with comments toward an employee recognition goal and foster motivation.
Establish recognition goals for people doing comparable work too. Frontline technicians who handle frequent customer contacts and specialists who work on a few complex cases have different opportunities to collect comments.
What a good CSAT score should help you decide
Start with that 80% CSAT as a rule of thumb, then let your data collection tailor the score to your business. Compare yourself to the closest comparable peers to determine if the result is strong. The responses behind the score tell you how much confidence to place in that judgment. Once both are clear, decide whether to sustain good service, improve survey participation, or address a specific service problem.
Sound like a hassle? Book a Crewhu demo to learn how to investigate account-level feedback and linked tickets with ease and drive a strong overall CSAT score.