.png)
Key Takeaways
- CSAT (customer satisfaction score) measures customer satisfaction with one specific interaction or touch point.
- You can improve your score by responding quickly to customer feedback and routing low scores to managers immediately, before frustration has time to build.
- Boost survey completion with short, well-timed surveys sent through the customer's preferred channel.
- Pair CSAT with NPS and CES for a complete picture of customer experience health.
For a service business, client retention lives and dies on how customers feel after a ticket closes. You can have airtight SLAs, a well-staffed help desk, and fast average resolution times … and still lose an account because the client never felt heard. Quality service, top-notch customer management, intuitive website and app design, and a quick response to customer demands all serve to make customers happy.
But that’s only half the battle. The next, equally important step is convincing them to voice that satisfaction and help others learn about your business. This inevitably leads you to CSAT.
A single happy client who never tells you (or anyone else, for that matter) that they're happy is a missed opportunity for both retention and word-of-mouth growth. CSAT can close that gap by giving customers an easy, low-friction way to express exactly how a specific experience went.
What Is a CSAT Survey?
A CSAT (customer satisfaction score) survey is a tool that measures how satisfied customers are with a specific interaction, product, or service. It usually boils down to one core question: "How satisfied were you with your experience?" Some businesses leave it as an open-ended inquiry to encourage detail-rich responses. Others use a simple yes/no format to keep things brief and maximize completion rates. But most companies opt for a rating scale, typically ranging from 1 to 5 or 1 to 10, because it strikes a balance between speed and nuance.
The advantage is that it's fast to deploy and simple enough that customers rarely hesitate to complete it. This translates into solid response rates and, in turn, statistically reliable results, which makes CSAT especially useful for smaller businesses that don't have the volume to support more complex metrics. Service businesses enjoy the high volume as well; help desks generate a steady stream of ticket closures, which means even a modest response rate gives you a statistically reliable read on service quality without needing a huge client base.
Knowing how and why a customer is satisfied or dissatisfied is crucial. It tells you where a specific process is working, where it's breaking down, and which technicians and ticket types are consistently landing well. It can also act as an early warning system. A sudden dip right after you roll out a new ticketing workflow, change an SLA, or onboard a new hire onto the service desk often shows up in the data weeks before it shows up as a lost contract.
Be aware, CSAT isn’t a general impression clients have of your brand as a whole. Instead, it gauges satisfaction at a single touch point (e.g., support ticket, project closeout, quarterly business review). What you get from each response is a small, measurable data point that, when aggregated, gives you a CSAT score that reflects the health of that specific process or technician over time. It works best alongside other metrics rather than as a standalone measure of overall account health.
CSAT vs. NPS and CES
CSAT is one data point that needs other information to give a comprehensive understanding of the customer experience. You can supplement your findings with NPS (net promoter score) and CES (customer effort score), which measure different aspects of the customer experience.
- NPS looks at the bigger picture. It asks customers, "How likely are you to recommend us to a friend or colleague?" It uses a 0–10 scale, sorting respondents into detractors (0–6), passives (7–8), and promoters (9–10). The score is calculated:
% Promoters - % Detractors = NPS
This yields a score from -100% to +100%. A negative score means you have more Detractors, while a positive score means you have more Promoters. NPS is typically assessed (quarterly or annually) to gauge overall loyalty and brand health rather than reactions to a single interaction.
- CES zooms in on friction. It asks how easy a specific interaction was, usually on a 1–5 or 1–7 scale. It’s framed around a single moment like resolving a support ticket or completing checkout. Unlike NPS, it's inherently transactional and sent immediately after an interaction. Scores are typically reported as a simple average.
Companies typically use all three because each answers a different question: CSAT flags whether a specific interaction went well, CES reveals how much friction that interaction involved, and NPS tracks whether accumulated experiences translate into loyalty.
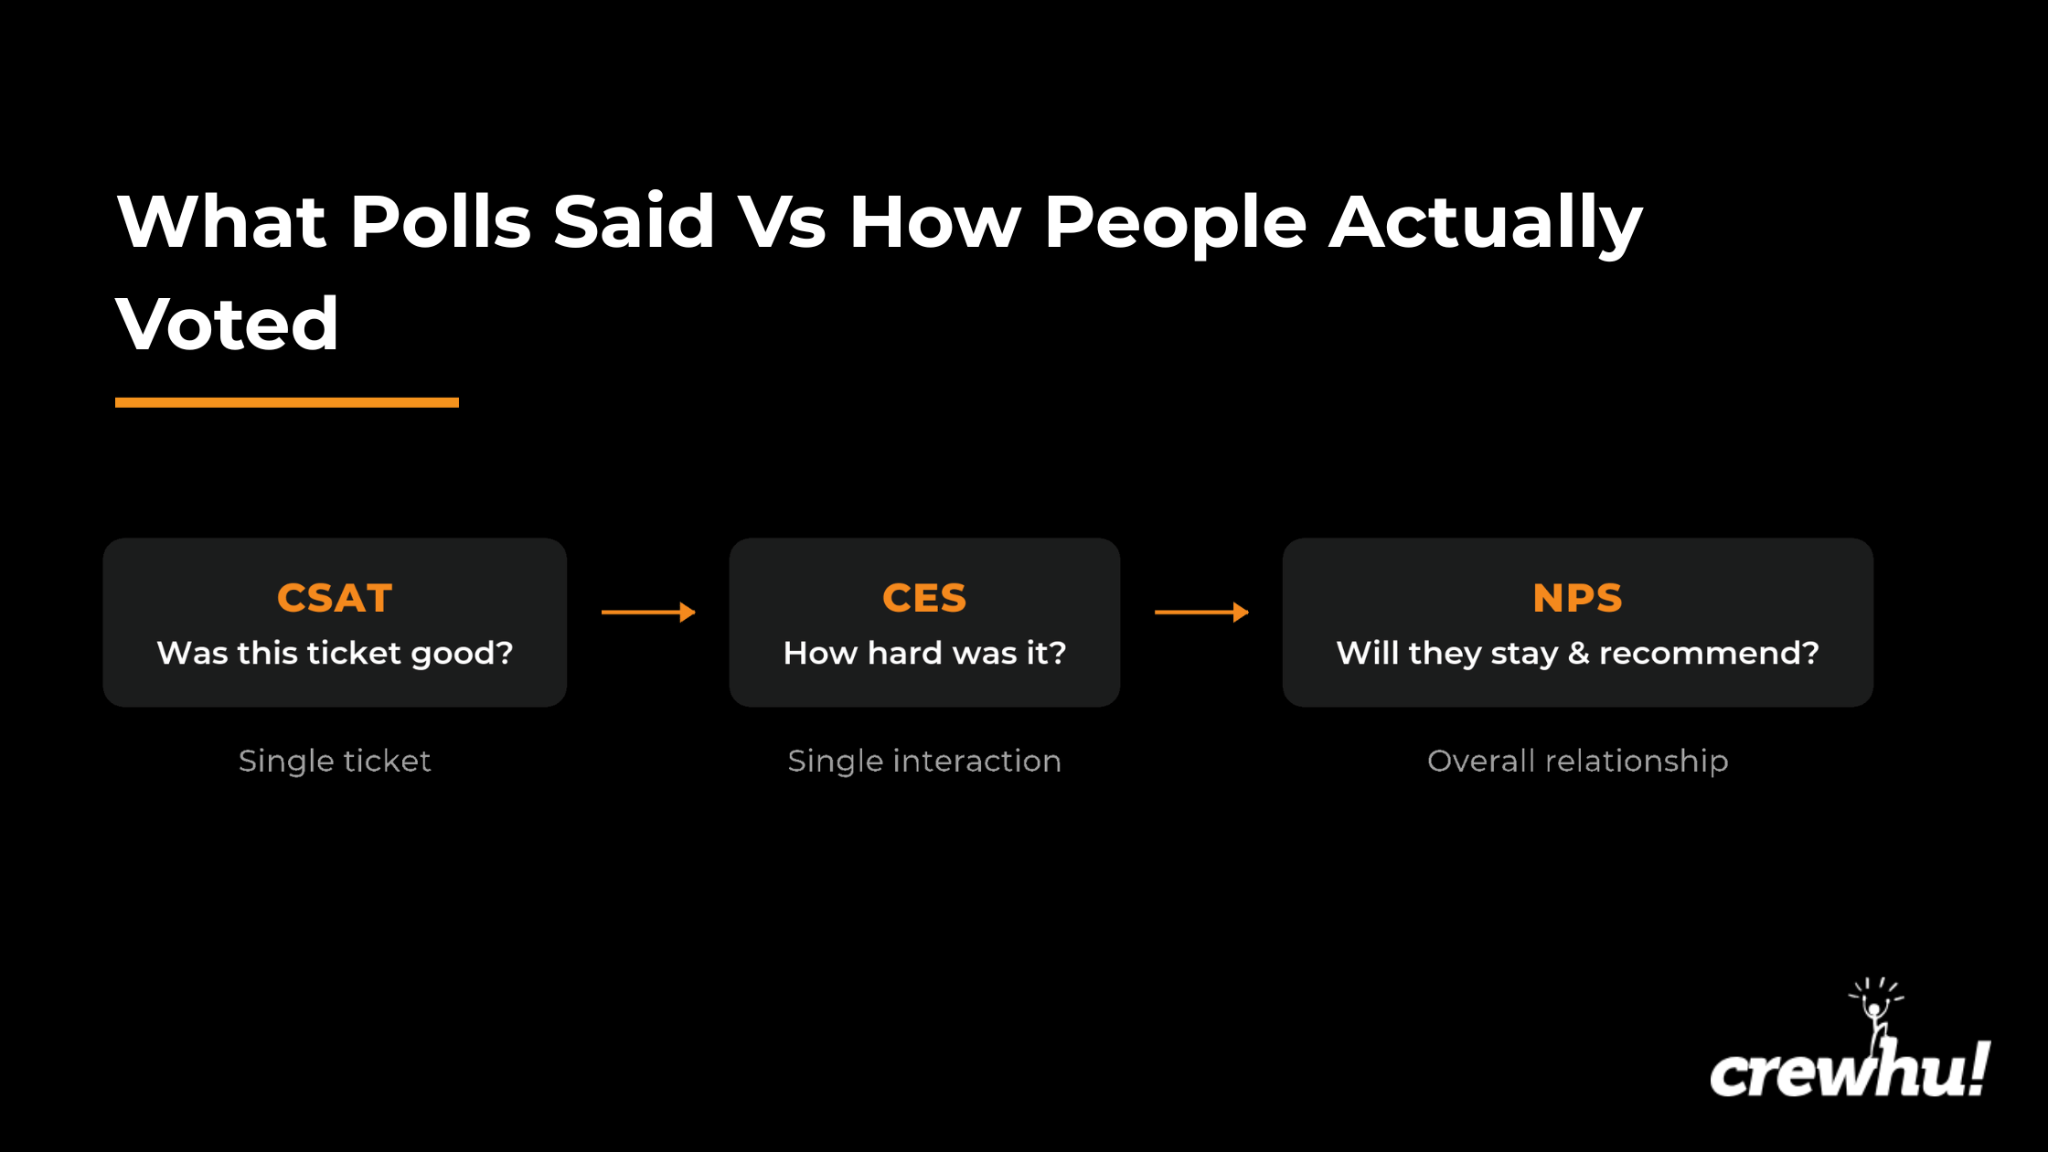
For example, a company might see CSAT dip on tickets tagged "server downtime." Then they check CES and discover clients rate those tickets as "difficult" due to long resolution times and repeated status check-ins. Left unaddressed, that friction shows up months later as falling NPS and client churn, since IT clients who feel unsupported rarely renew their contract. But when they are combined, the metrics form a chain: CSAT and CES diagnose which ticket types are creating friction right now, while NPS confirms whether fixing that recurring issue actually rebuilt the client's long-term confidence.
How to Calculate Your CSAT Score
A business’s CSAT score is expressed as a percentage of satisfied respondents relative to total respondents. The formula is simple:
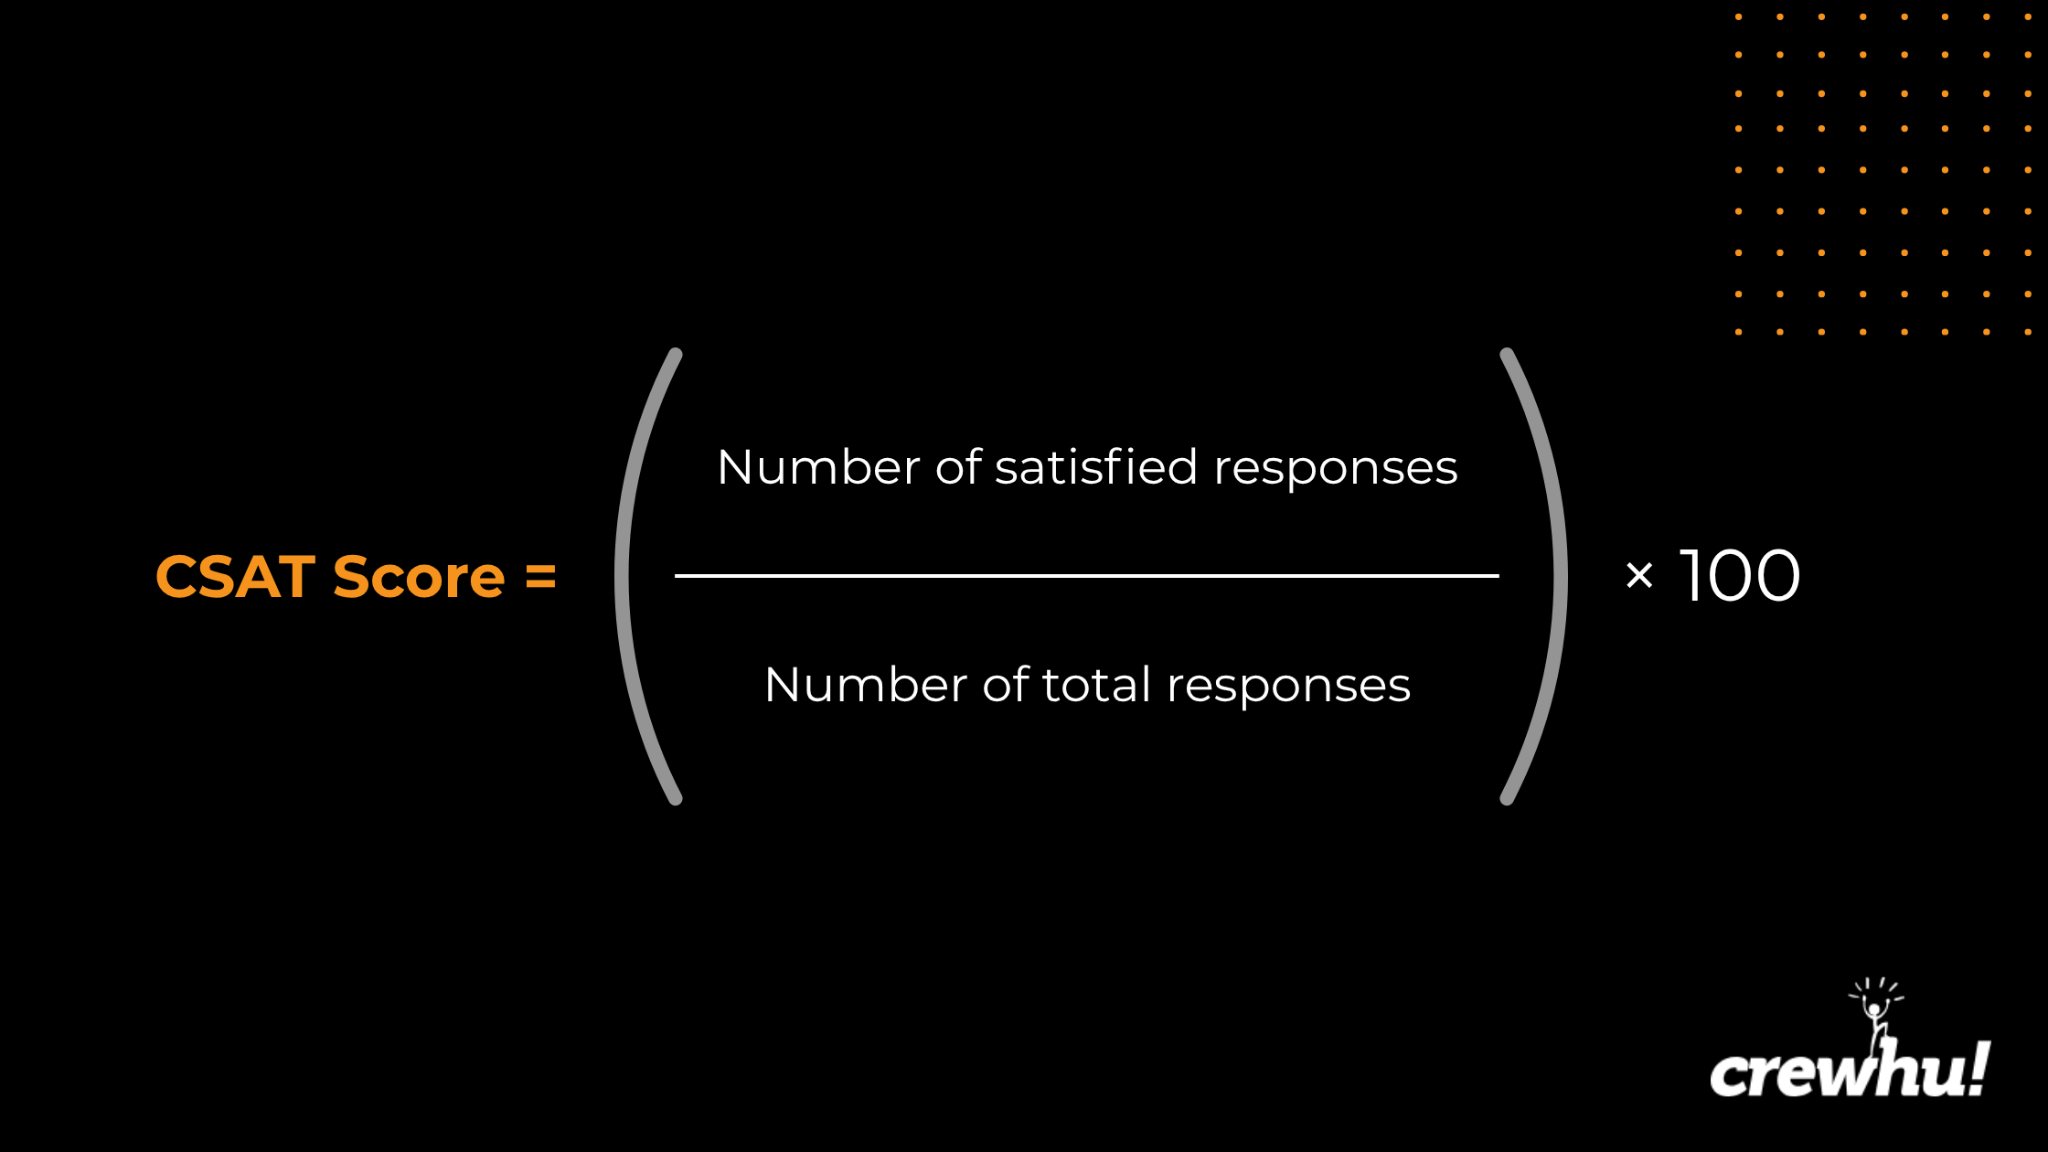 So, an MSP that closes 100 tickets with surveys attached and gets 80 satisfied responses has a CSAT of 80%.
"Satisfied" in this context means respondents who selected the top options on the scale, typically a 4 or 5 on a 5-point scale or a 7 through 10 on a 10-point scale. Incomplete or abandoned survey responses should be excluded when running the numbers because they can skew your results and make comparisons across time periods unreliable.
Calculating your score once won't tell you much since a single data point has no context. You don't know if 80% is an improvement, a decline, or simply business as usual. To make the metric genuinely useful, you need to track it consistently, whether it’s weekly, monthly, or per campaign. The longer you track a specific service or product's CSAT, the more reliable your trend lines become, and the easier it is to tell the difference between normal fluctuation and a real problem.
You should also segment your CSAT data wherever possible. Breaking scores down by technician, ticket category, client, or SLA tier can reveal patterns that a single blended score would hide entirely. A company might have a perfectly respectable overall CSAT while one specific technician or even one recurring ticket is quietly dragging down the average.
What Is a Good CSAT Score by Industry
While CSAT is a widely used metric, there’s no universal standard for it. Benchmarks vary significantly across industries and are shaped by factors like customer expectations, price sensitivity, and how emotionally invested people are in the product or service. That’s why it's important to understand the benchmarks relevant to your specific industry and compare your score against sector-specific averages instead of chasing a single universal target. For example:
- An average CSAT score an MSP should target is at least 75%.
- For comparison, retail and eCommerce sectors average CSAT scores between 75% and 85%, reflecting their transactional, high-volume interactions.
- Financial services often set internal targets above 80%, given the higher stakes and trust involved in those relationships.
- The average CSAT score across the IT service/help desk industry is about 73%, according to HDI.
As a rule of thumb, a score below 60% signals urgent problems that deserve immediate attention. Falling below 50% essentially means more people are dissatisfied with your service than satisfied with it. It’s a red flag that points to a systemic issue rather than an isolated bad experience.
On the other end, scores consistently above 90% are excellent but worth double-checking for survey bias, since very high scores sometimes indicate that only your happiest customers are bothering to respond.
Be sure to revisit your benchmark periodically as well. Customer expectations shift over time and often increase, so a score that felt strong two years ago might now be average within your industry. Comparing your own historical trend alongside external benchmarks gives you a more grounded sense of whether you're actually improving or just holding steady while the bar rises around you.
How to Improve Your CSAT Score
Improving CSAT often comes down to reaching out to unhappy customers right away. Get to them before their frustration has time to settle in. To boost your response speed, set up automated workflows that flag low scores and route them to service managers the moment they come in so nothing sits unnoticed in a dashboard for days.
A real-time CSAT dashboard that surfaces negative responses as they arrive and routes them straight to the right manager empowers a business to address poor feedback within hours instead of it getting buried until the next QBR. That speed matters enormously: A client who receives a thoughtful follow-up shortly after a bad experience often walks away more loyal than one who never had a problem in the first place, simply because they saw the company respond (often referred to as the service recovery paradox).
Don't keep CSAT feedback siloed within customer support either. Share results with engineering and technicians directly responsible for the account. Aggregating individual complaints often leads to upstream fixes that prevent the same issue from recurring in the future. Some of the highest-leverage improvements to a CSAT score come from product changes that eliminate the need for a customer to contact support in the first place.
Take software company InspectionXpert, for instance: They connected their support-ticket data with customer feedback and analyzed the recurring questions to identify where users were struggling. As a result, the company discovered that 50% of their support tickets came from customers not knowing how to use their product. Rather than simply answering those questions repeatedly, InspectionXpert expanded and improved their knowledge base by adding help articles, videos, and documentation around the areas generating the most tickets. These actions led to a 25% decrease in support tickets.
For a service business, the equivalent might be a client who keeps opening tickets for the same password reset or printer issue. A five-minute self-service guide can quietly lift both CSAT and technician capacity at the same time.
Best Practices for Higher Response Rates
Survey design and delivery decisions highly influence how many customers actually complete your CSAT survey. To give your responses the best chance for success, follow these recommendations.
Favor short, concise surveys
Keeping the survey short goes a long way toward preventing drop-off. Research from Shep Hyken found that 67% of customers won’t complete a survey if it’s too long. For CSAT, that usually means more than three or four questions. So, unless you have a really good reason, don’t stuff your survey full of questions.
Pick the right channel for your customers
Besides the number of questions, it also matters where the survey shows up. Match your delivery channel to how the customer prefers to communicate, whether that's a webpage, email, or an in-app prompt. Tellingly, SMS surveys have a response rate of 45% - 60%. Meanwhile, in-app have 20% - 30%. While embedded emails have 15% - 20%.
Time the survey shortly after an interaction
Timing is critical as well. A survey sent immediately after a ticket closes outperforms one sent hours or days later, when the details of the interaction have already faded from memory. Additionally, Survey Monkey learned that customer surveys sent on Monday had a 10% higher response rate than the average in general. These post-call surveys are a useful way to collect accurate customer feedback, especially if you want to know more about a specific interaction, so don’t wait to send them.
Customize and personalize for better response rates
Treat your survey the way you'd treat any other piece of content meant to convert. Don’t rely on your intuition to figure out what works; test it. For instance, simply adding colorful buttons or emoticons to an emailed survey can boost response rate by 25%, according to Help Desk Migration. In a larger sample, this can mean hundreds of additional full responses.
Making your questions more conversational, such as saying, "How was your experience today?" instead of, "Please rate your satisfaction," can shift response rates as well. These question formats reach roughly an 85% completion rate compared to 22% for traditional formats.
Also, customizing questions to fit specific interactions yields better results than using a general survey for every interaction. Personalize the trigger by referencing the client’s name and the specific interaction they just had to make the request feel less like generic spam and more like a genuine, individualized follow-up. In fact, research from Cochrane Library found that the odds of response increased by about 25% when a personalized approach was adopted.
Pilot the survey internally
An underrated tactic is pilot testing the survey internally. By trialing the survey within your organization, you can identify design issues, eliminate completion time, and hone in on the best collection methods, such as mobile versus face-to-face. If you feel like you’ve gotten the hang of what a decent survey should look like, use your employees to role-play as clients and try it out. Their responses can reveal friction points before they become an issue with the customers.
Types of CSAT Survey Questions
Picking the right question format shapes the quality and depth of the feedback you collect:
- A 5- or 10-point scale is the standard choice since it lets customers express degrees of satisfaction. If you need something faster and more frictionless though, particularly on mobile, a simple yes/no question often does the job, trading nuance for speed.
- Multiple-choice questions are useful when you want to pinpoint exactly which part of an experience fell short, rather than just knowing that something was less than satisfactory and then having to hunt for it. For example, asking a client to select which aspect of a project rollout was disappointing (e.g., timeline, communication, technical execution, or documentation) gives you actionable detail that a plain satisfaction score can't.
- Open-ended follow-ups uncover the "why" behind a score. This is the context a number alone can't give you, and it's often where the most useful, specific insights live. If you're aiming for higher response rates in a consumer-facing setting, emoji or star-based scales tend to feel more approachable than a plain numeric grid.
These design choices can greatly affect both completion rates and the emotional tone of the feedback you receive.
How to recover from a low CSAT score
A single bad score calls for a fast response. A CSAT score that's stayed low for months usually means the problem is structural. Start by pulling your segmented data to find the pattern: Is it concentrated in one technician, one ticket category, or one SLA tier? A flat score across the board often points to something upstream. That can mean chronic understaffing, an SLA that's out of sync with what clients actually expect, or a ticketing workflow that creates friction before a technician even gets involved.
Go past the survey numbers and talk to a handful of affected clients directly. A short call usually captures context that a 1–3 rating can't. If the issue traces back to specific technicians, treat it as a coaching opportunity rather than a disciplinary problem. If it's systemic, fix the underlying process. That may entail adjusting staffing, reworking escalation paths, or overhauling the workflow that's creating friction.
Whatever you do, track your score weekly during recovery. Then, once the changes are in place, show clients what changed in response to their feedback. When companies make adjustments based on customer feedback, Forbes found that 77% of clients viewed the organization in a more positive light.
Biases present in CSAT Surveys
Like any metric, CSAT has both noteworthy strengths and some limitations worth keeping in mind as part of a balanced measurement strategy. The greatest obstacle with this measurement is bias, as CSAT is prone to a few types that skew results.
Cultural bias
Different regions and demographics don't necessarily interpret rating scales the same way, leading to a cultural bias. For example, a "7" doesn't always carry the same weight everywhere, which complicates comparisons across global customer bases.
For example, Skimgroup conducted a study that compared countries that are more direct in their interactions (France, Germany, and Spain) to less direct ones (Brazil, Japan, and the Philippines). Among the questions they asked was, “Do you find this product appealing?” The more reserved countries showed a higher percentage of “yes” responses (85.5%) compared to direct countries (77.1%). The people with a culture of being less direct showed a greater reluctance to provide negative feedback. So, when designing a CSAT survey, consider the background of the people you’re sending it to.
Wording/Leading-Question Bias
Wording bias happens when the phrasing of a survey question nudges the client toward a particular answer instead of capturing their honest opinion. For a service business, this often creeps into satisfaction surveys through subtle self-flattery; asking, "How satisfied were you with our excellent, industry-leading support team?" primes clients to respond positively rather than critically.
Non-Response Bias
Non-response bias occurs when the clients who actually respond don't represent your full customer base, because certain groups opt out. For service businesses, this typically means your busiest or most indifferent clients (often the ones quietly considering other providers) never open the CSAT ticket survey. Meanwhile, extremely happy or frustrated clients respond at disproportionate rates.
Social desirability bias
People don’t always say what they really mean, especially when they feel pressured to respond in a socially acceptable way. If users think a certain answer is more polite or less polarizing, some will choose it. This social desirability bias when answering questions is common when individuals are put under a spotlight.
The political sphere is all too familiar with this bias: In both the UK's 1992 election and the 1982 California governor's race, for example, voters told pollsters they planned to vote for one candidate, but then voted differently in private. The reason was that admitting an unpopular preference to a live interviewer felt uncomfortable.
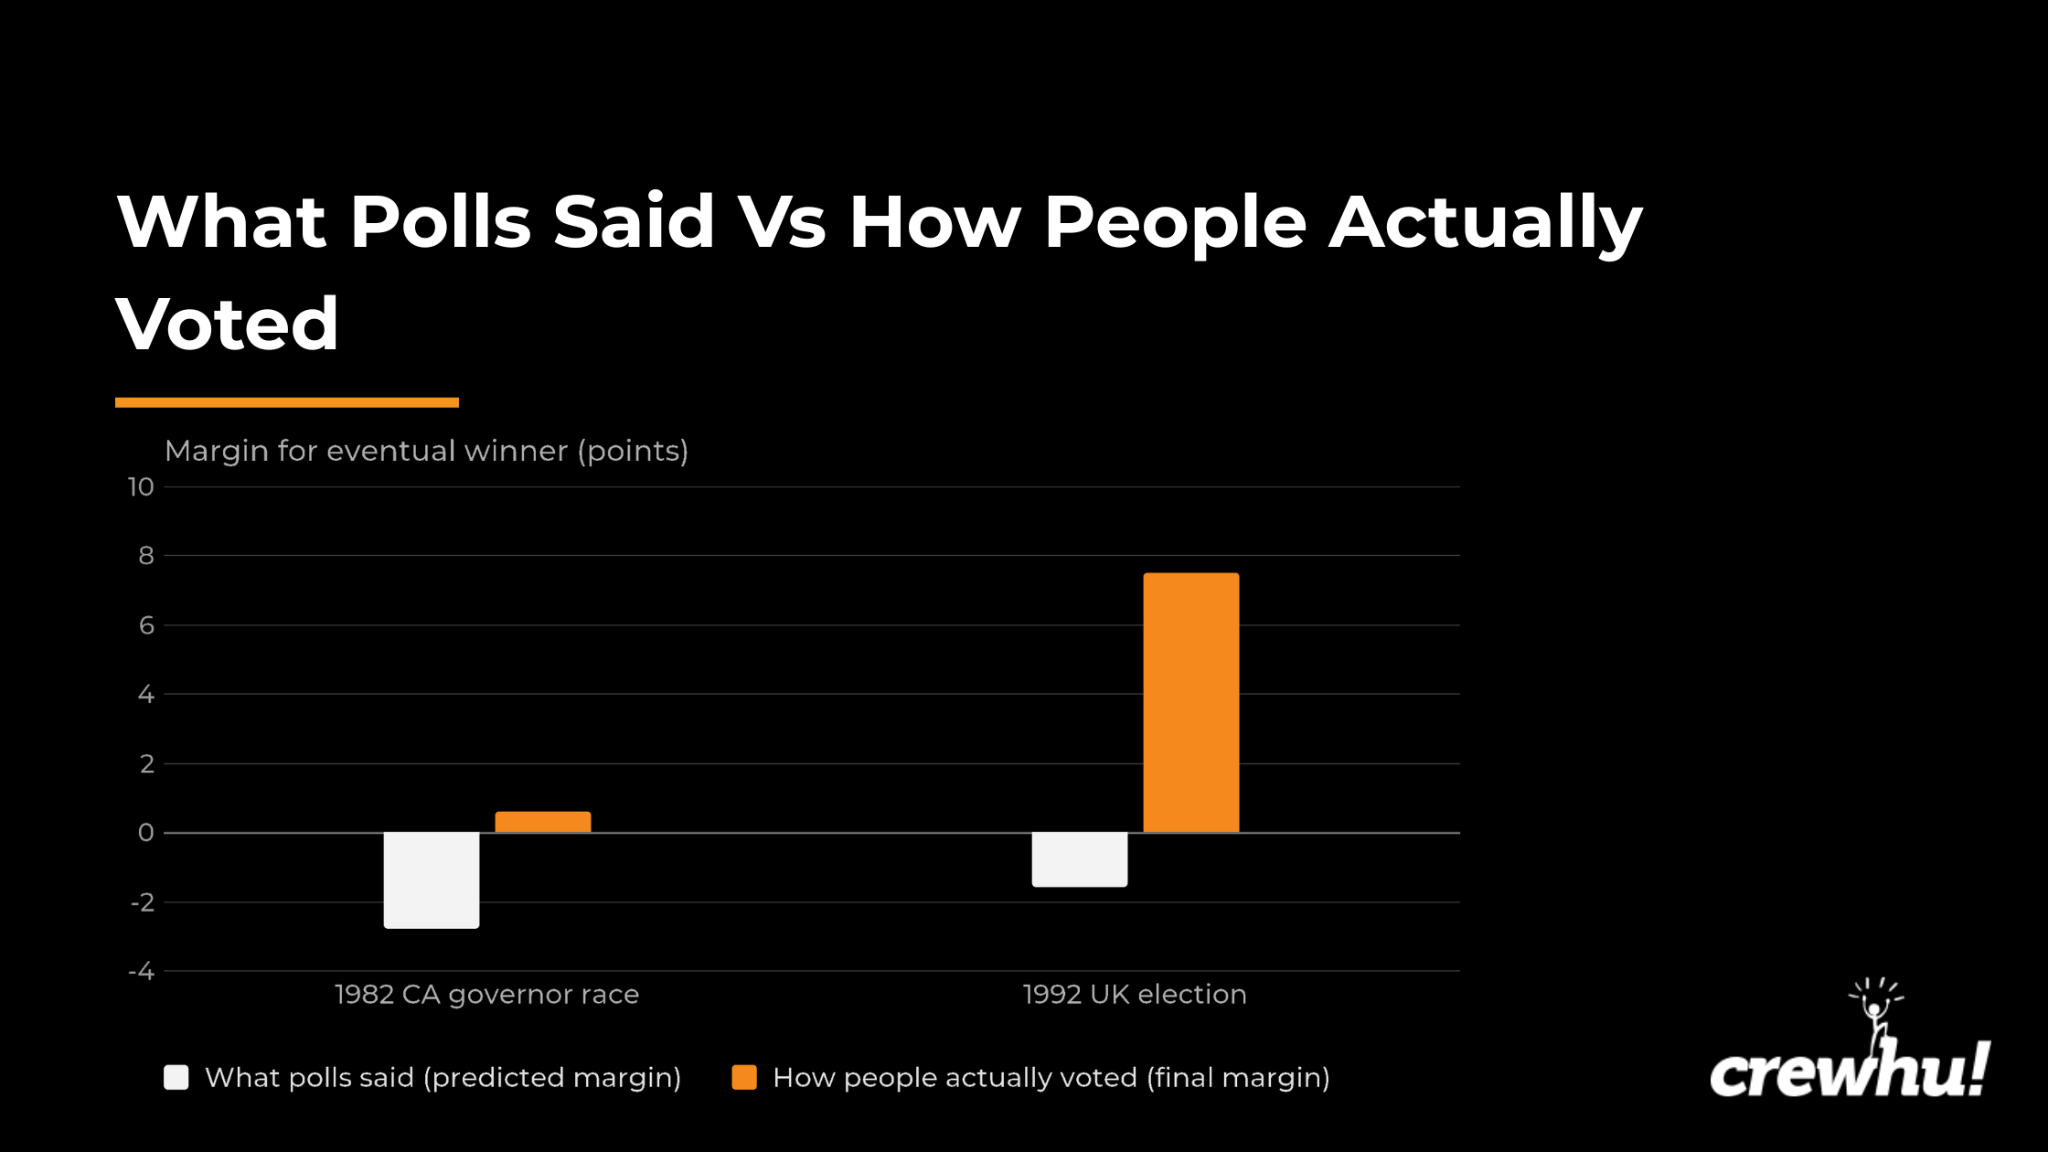 Pollsters have since responded by moving toward anonymous, self-administered formats (online or automated phone) instead of live interviewers to avoid this bias. As a result, they consistently produce more honest answers. The same logic applies to CSAT, where a client is more likely to give an honest low score to an anonymous one-click survey than to a technician asking, "Was everything okay?" over the phone.
Mitigating CSAT bias
Neither of these biases can be eliminated outright, but they can be managed.
- For cultural bias, build regional baselines and track movement within each region rather than comparing absolute numbers across them. Zappi recommends first analyzing scores against the norms of the country where they were collected. Then compare the differences from that baseline across markets, instead of stacking raw numbers side by side.
- For wording/leading question bias fix is neutral, single-idea phrasing: “How satisfied were you with your support experience?" There should be no adjectives implying a "correct" answer. Randomizing question order and having someone outside the project review survey drafts before sending also catches bias that the writer may not notice in their own wording.
- For non-response bias the solution to this is fairly simple. Provide small incentives or rewards for responses. A Gallup study found that providing a $1 incentive increased their response rate from 11.8% to 26.3%.
Conclusion
CSAT isn't a verdict on your MSP as a whole. It's a fast, honest read on how one ticket, project, or interaction landed with a client. Tracked consistently and segmented by technician, ticket type, and SLA tier, it shows where service is genuinely strong and where it's quietly slipping, ideally before that slippage shows up as churn.
Paired with CES and NPS, CSAT becomes part of a real diagnostic chain flagging friction, measuring effort, and confirming whether fixes actually rebuild long-term loyalty. But none of it works if surveys don't get sent, tracked, and acted on consistently, and low scores don't reach the right person fast enough to matter.
That's the gap Crewhu was built to close. Crewhu automates CSAT and NPS collection right at ticket close through your PSA or ticketing system, surfaces negative feedback to managers in real time, and ties results directly to technician recognition and gamification. That way, good service gets noticed, not just measured.
Book a demo to see how Crewhu can help you turn CSAT into a tool for retention and revenue.
FAQs
What's the difference between CSAT and NPS?
CSAT and NPS measure different things. CSAT captures satisfaction with a single interaction or transaction. It focuses on the short-term, reflecting how a customer felt about one specific experience. NPS measures overall loyalty and the likelihood of a customer recommending your brand to others. It's long-term in scope, giving a broader view of the relationship rather than one moment.
What's a good CSAT score out of 5?
On a 5-point scale, a strong CSAT score is typically about 80% or higher, meaning customers are consistently choosing 4’s and 5’s rather than lower ratings. That said, "good" is relative. Benchmarks vary by industry, so compare your score against sector norms rather than assuming a fixed number applies universally across all businesses.
What does CSAT ask?
A CSAT questionnaire almost always takes the form of "How satisfied were you with [interaction/product/service]?" It can be answered using a rating scale, whether numeric, star-based, or emoji-based. Many surveys pair this with an optional open-ended follow-up asking customers to explain why they chose that particular rating, which adds valuable context beyond the numeric score alone.
Can CSAT scores be automated end-to-end?
For the most part, yes. Most modern helpdesk and CX platforms can automatically trigger the survey, collect customer responses, calculate the resulting score, and route negative feedback straight to a manager for follow-up. That said, human review is still important for this process, especially for interpreting open-ended comments and spotting broader patterns across responses.
Can CSAT be measured without a survey?
Not reliably. You can make educated guesses about satisfaction by looking at signals like repeat purchases or complaint volume, but these are indirect proxies at best. CSAT is a self-reported metric, meaning it depends on directly asking the customer for their input. Without that direct response, what you're measuring isn't a true CSAT score.