Key Takeaways
- Your customer count can rise even as existing customers leave. Customer retention shows how many of the customers you started with are still active at the end of the period.
- A recurring-service provider can post 105% net revenue retention (NRR) while gross revenue retention (GRR) is only 85%. Expansion offsets the lost revenue. Investigate whether that loss came from canceled accounts, reduced service packages, or both.
- Judge repeat business by the service cycle. A customer returning for a new completed job has bought again. A technician finishing the original repair hasn't made a second sale.
- Renewal rates can hold steady even as service satisfaction falls. Customer satisfaction score (CSAT) can flag problems with an individual job, while net promoter score (NPS) can reveal concerns about the wider relationship before the next contract decision.
- Revenue isn't the same as customer contribution. A $10,000 annual contract with $6,000 in variable service costs leaves $4,000 to cover overhead and profit.
A maintenance company can renew nearly every contract and still hear complaints about late service updates. A repair shop for its part can earn excellent satisfaction ratings from customers who have no reason to book another repair. Both look healthy based on one measurement while leaving important questions unanswered. Are customers continuing to buy? What do those relationships contribute after service costs? Where does the service experience need work?
Contracts, completed jobs, recurring charges, service costs, and customer feedback each tell part of the story. Start with the customer decision you're trying to understand, then compare the customer loyalty KPIs that help answer it. When the numbers seem to tell different stories, look more closely at what's happening with those customers.
Which customer loyalty KPIs should you track?
For ongoing service contracts, customer retention, churn, and renewal rates show whether customers stay. For repair shops and other businesses that sell separate jobs, repeat customer rate, service frequency, and recency show who comes back, how often, and how recently they were served. Revenue KPIs show what those relationships bring in and contribute, while CSAT and NPS add feedback on individual services and the wider relationship.
An MSP may want to know how many contracts customers renewed, while a repair shop might care more about who came back for another completed job. Maybe you're watching recurring revenue or trying to make sense of customer feedback. Whatever the concern, look for the question that fits.
|
What do you want to know? |
KPIs to check |
|---|---|
|
How many of the customers we started with are still active? |
Customer retention rate and customer churn rate |
|
When contracts came up for renewal, how many were renewed? |
Renewal rate |
|
Are customers coming back for new jobs? How often, and when was their last job? |
Repeat customer rate, service frequency, and recency |
|
Did recurring revenue from the customers we started with go up or down? |
Gross revenue retention (GRR) and net revenue retention (NRR) |
|
How much revenue does each completed job bring in? What might a customer contribute over time? |
Average service/order value and customer lifetime value (CLV) |
|
How did customers rate a recent service? Would they recommend us? |
Customer satisfaction score (CSAT) and net promoter score (NPS) |
You don't need all 12 KPIs in your first report. Begin with the one or two that answer your most pressing question. Then look at the revenue or contribution involved and check what customers said about their experience when it helps explain the result.
Whatever you track, keep your customer, agreement, and completed-job records linked with stable IDs. One customer with three contracts counts as one customer and three agreements. If a repair takes several technician visits to finish, it's still one completed job.
Customers who stay, renew, and return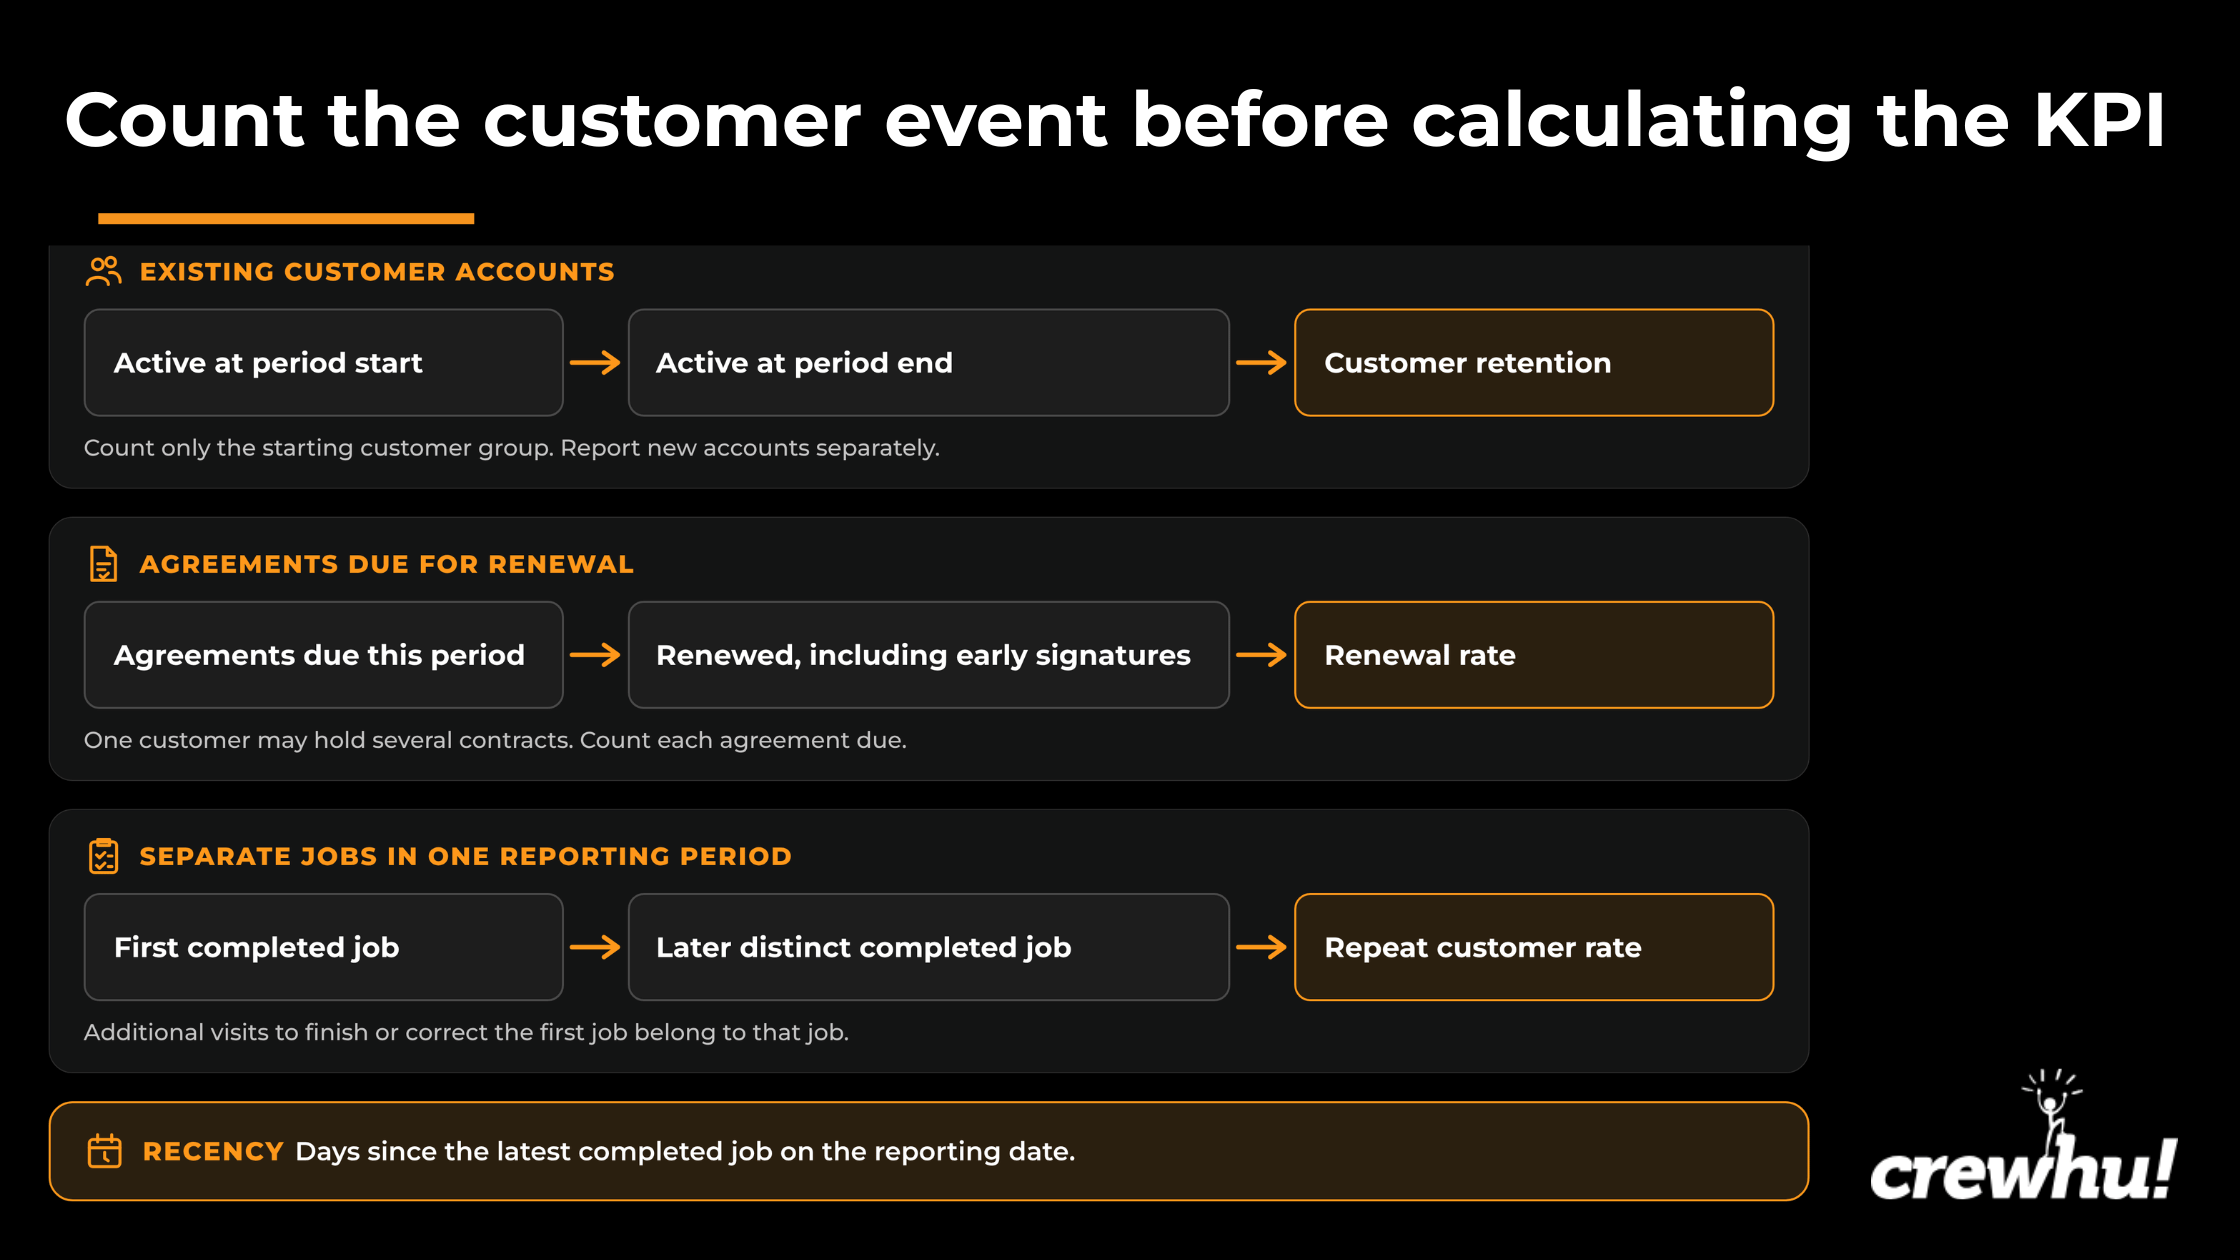
1. Customer retention rate
Customer retention rate tells you what percentage of the customers you had at the start of a reporting period are still active at the end. For a maintenance company, an account might count as active while its service agreement is in force.
Customer retention rate = (Starting customers active at period end ÷ Customers active at period start) × 100
Say a maintenance company starts the year with 1,000 active customer accounts. By December 31, 880 of those original accounts are still active. That's a retention rate of (880 ÷ 1,000) × 100 = 88%. New customers who signed up during the year don't change that calculation.
The company might still finish the year with more customers overall, even though 120 of its starting accounts are no longer active. Looking at those 120 accounts by service type or contract group can show whether the losses share a pattern.
2. Renewal rate
Renewal rate is the percentage of agreements due for renewal that customers renew. An agreement belongs in the reporting period when it's due, even if the customer signs early.
Renewal rate = (Agreements renewed among those due in the period ÷ All agreements due for renewal in the period) × 100
For instance, a maintenance company has 200 annual agreements coming up for renewal this year. Customers renew 184 of them, giving the company a renewal rate of (184 ÷ 200) × 100 = 92%.
That company could have 1,000 active customer accounts but only 200 agreements up for renewal. Some customers have multi-year contracts, while others hold more than one agreement. The 92% applies to those 200 renewal opportunities, not to the share of customers who stayed.
A customer might renew in November even though the agreement isn't due until January. It counts toward January's renewal rate, but the customer made the decision in November. To understand why, look at the offer, service records, and CSAT or NPS feedback available before they signed, along with what the decision-maker says mattered. A complaint in December is a new service issue to address before the customer's next contract decision.
3. Customer churn rate
Customer churn rate shows what percentage of the customers you started with are no longer active at the end of the reporting period. It uses the same dates and definition of an active account as customer retention rate.
Customer churn rate = (Starting customers inactive at period end ÷ Customers active at period start) × 100
Of the fictional maintenance company's 1,000 accounts active on January 1, let’s say 120 are inactive on December 31. That's (120 ÷ 1,000) × 100 = 12% churn, alongside 88% retention for the same starting customers.
A year-end rate can hide an interruption during the year. An account might cancel in April, return in October, and be active again in December. It still counts as retained at year-end, but the event log records the cancellation and return. The account manager can investigate what led the customer to leave and what brought them back.
4. Repeat customer rate
Repeat customer rate shows what share of customers had at least two separate jobs completed during the same reporting period. A return visit isn't always a new job though; it can be:
- A repair completed in March and a separate checkup completed in October count as two jobs.
- If a technician comes back to finish or correct the March repair, it's still part of the first job.
- An October appointment doesn't count as a second job until that separate job is completed.
Repeat customer rate = (Customers with at least two completed services ÷ Customers with at least one completed service in the same period) × 100
Over 12 months, a repair shop completes at least one job for 100 customers. Forty of them come back for a second, separate completed job. The repeat customer rate is (40 ÷ 100) × 100 = 40%. The service cycle matters too, as some customers may have no reason to book another job within that year.
A customer who visited in December 2025 and again in June 2026 might appear as a returning client in an appointment report. But if June was their only completed job in 2026, they don't count toward that calendar year's repeat customer rate.
Square's returning-client figure works differently though: Of the clients seen in a selected period, it counts how many had also visited in the preceding 12 months, then divides that number by all clients seen in that period. That can capture a return across calendar years. The completed-job rate requires two distinct jobs completed within the same reporting window.
5. Service frequency
Service frequency measures the average number of separate completed jobs per customer served during a reporting period. Repeat customer rate tells you how many customers came back. Frequency takes every completed job into account, including a third or fourth job for the same customer.
Service frequency = Completed services ÷ Distinct customers served in the same period
Assuming the repair shop from the previous example completes 160 separate jobs for 100 customers, that's 160 ÷ 100 = 1.6 jobs per customer. All 100 customers have at least one completed job, leaving another 60 jobs among the 40 who returned. That means at least some of those returning customers came back more than once.
If frequency rises next year, check whether returning customers completed more jobs apiece or whether one-time customers make up a smaller share of those served. More jobs per returning customer may point to heavier service needs and more technician time. A shift in the customer mix alone can also lift the average, even if each returning customer completes the same number of jobs as before.
6. Recency
Recency tells you how long it's been since a customer's last completed service, measured on a specific reporting date. Whether that gap deserves attention depends on the kind of service the customer buys.
Recency = Reporting date − Customer's latest completed-service date
For instance, a maintenance company completes a monthly check on June 1. By July 1, the customer's recency is 30 days. If another check was scheduled for the end of June but wasn't completed, the manager can look into what happened.
At a repair shop though, the same 30-day gap after an emergency repair may simply mean the appliance is working well. And for a customer who books annual inspections, a month is far too soon to expect another job.
Customer revenue and contribution
7. Gross revenue retention (GRR)
Gross revenue retention shows how much of the monthly recurring revenue from customers active at the start of a reporting period remains after cancellations and downgrades. The calculation excludes expansion revenue from those customers, so upgrades can't offset those losses in the GRR result.
Monthly recurring revenue (MRR) is the monthly value of ongoing service charges. Here, the business compares MRR from the customers it had on January 1 with their MRR on March 31. Customers who signed up later in the quarter aren't part of the calculation.
GRR = ([Starting MRR − MRR lost to cancellations − MRR lost to downgrades] ÷ Starting MRR) × 100
Let’s say an MSP starts January 1 with 10 customers paying $1,000 a month each, for $10,000 in MRR. By March 31, one has canceled a $1,000-a-month agreement, and another has reduced their monthly package by $500. That makes GRR ([$10,000 − $1,000 − $500)] ÷ $10,000) × 100 = 85%.
The cancellation and downgrade leave $8,500 in MRR from those original customers before expansion.
8. Net revenue retention (NRR)
Net revenue retention shows whether monthly recurring revenue from customers active at the start of a reporting period has risen or fallen after cancellations, downgrades, and expansion. It includes upgrades and other added recurring services bought by those customers but leaves out recurring revenue from newly acquired customers.
NRR = (Ending MRR from starting customers ÷ Starting MRR from those customers) × 100
Going back to the same 10-customer MSP, imagine the remaining accounts add $2,000 in monthly recurring services. After the $1,500 lost to the cancellation and downgrade, MRR from the original customers reaches $10,500 on March 31. That's 105% NRR, even though only nine of the original 10 accounts are still active.
The provider ends the quarter with $500 more in MRR from its original customers and one fewer customer account. The manager can then look into why one account canceled and what prompted the others to add services.
To compare quarters, use the same length of reporting period and the customers active at the start of each quarter. If an account cancels and later returns, keep the reactivation rule consistent so reporting changes don't distort the trend.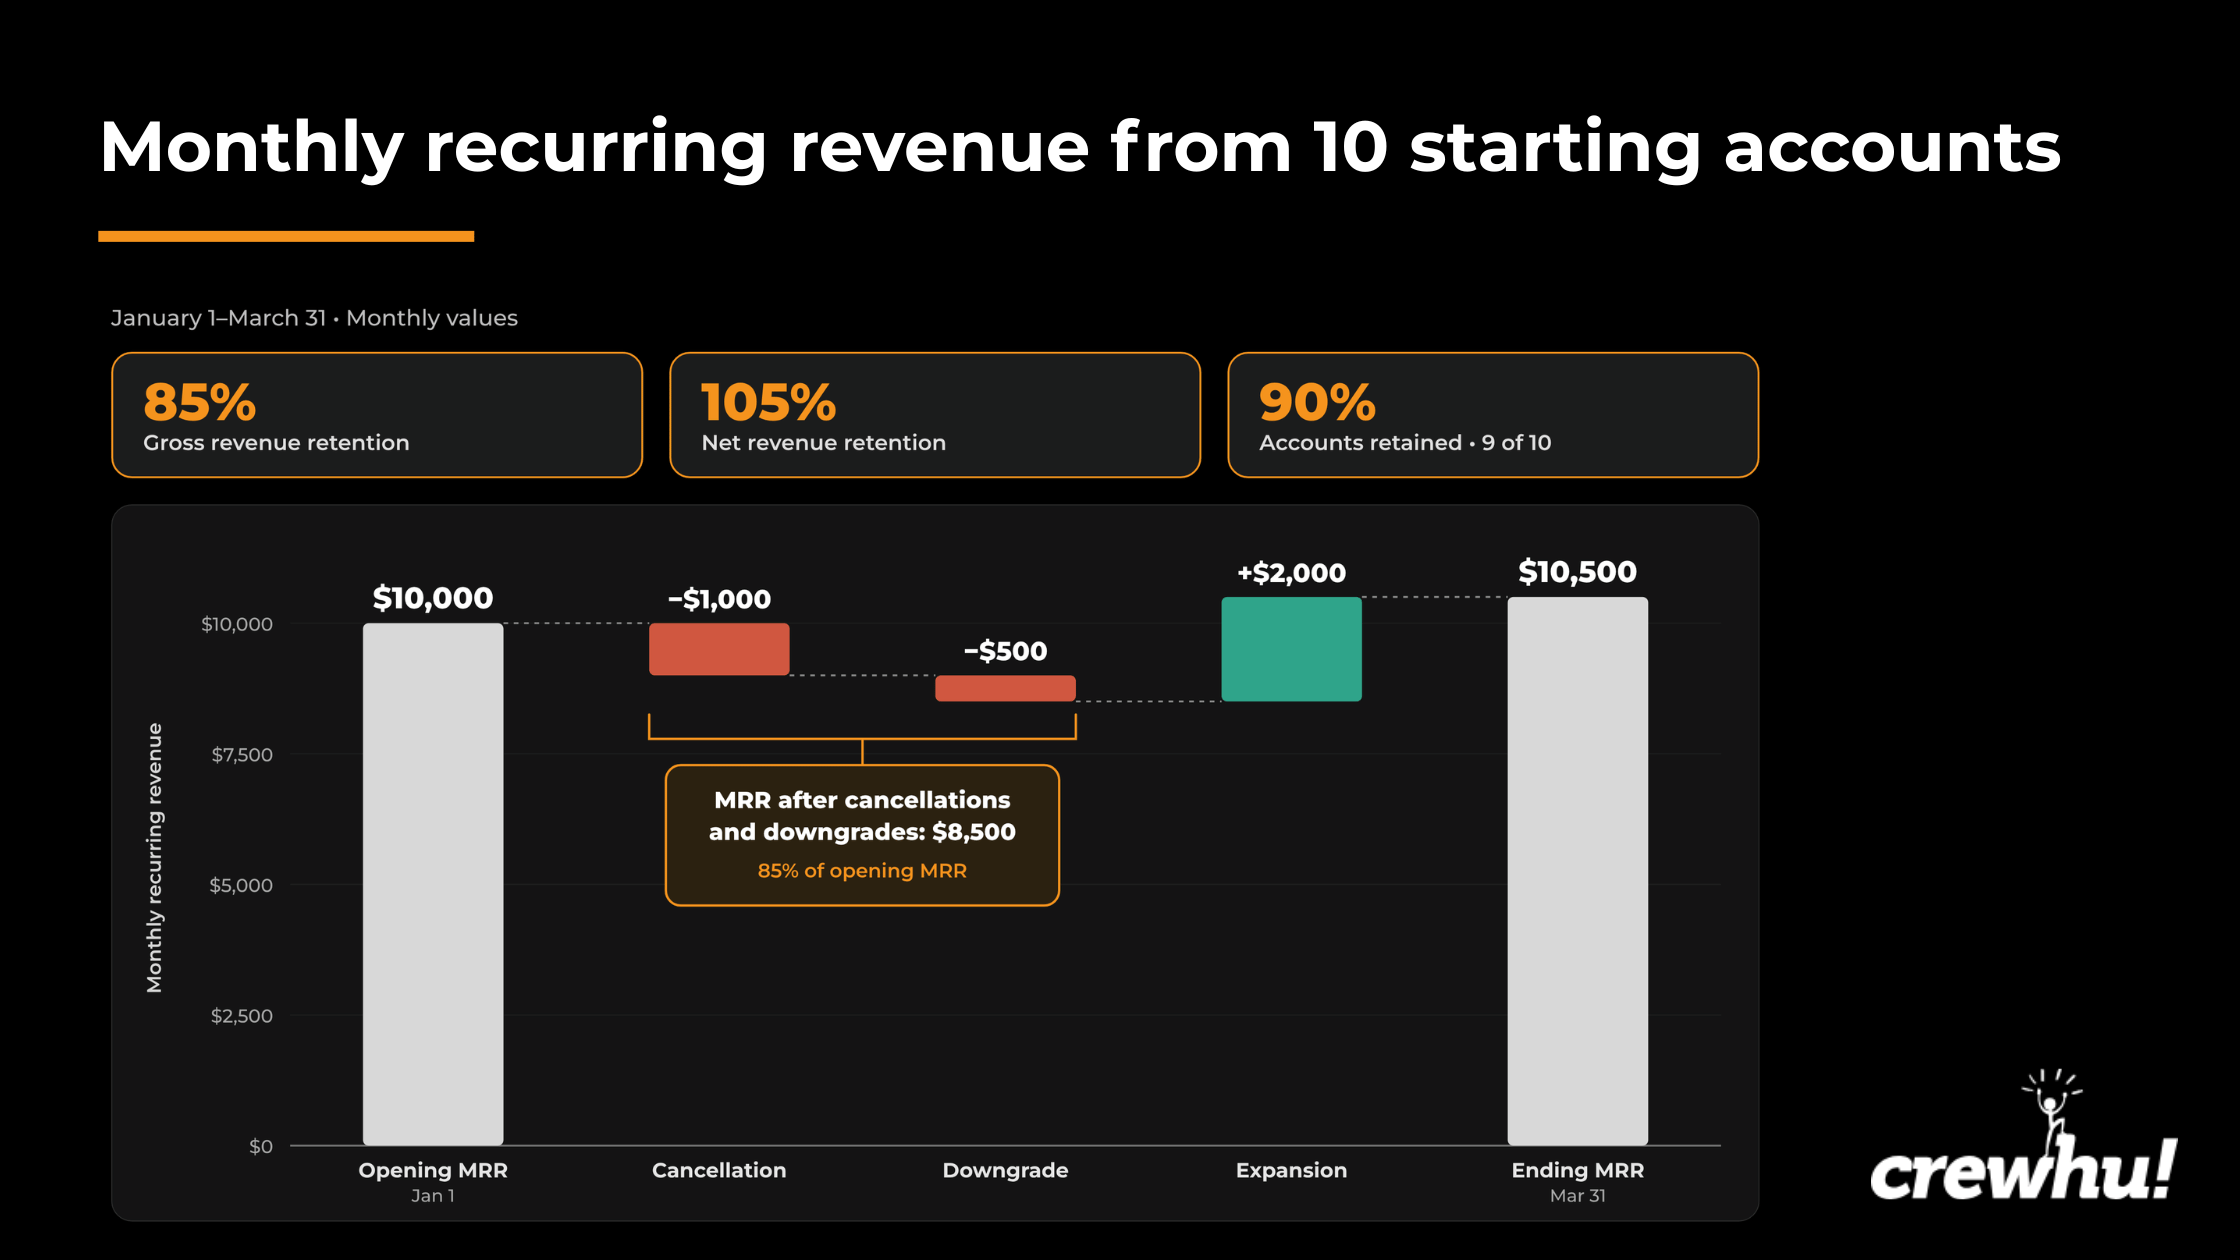 The extra services raise MRR but may require more technician time, parts, and other variable costs. What remains after those costs tells the provider how much the expansion contributes toward overhead and profit.
9. Customer lifetime value (CLV)
Customer lifetime value estimates how much a customer contributes over the whole relationship. Annual contribution is the annual revenue left after variable costs. Those expenses can include parts, technician time spent on each job, payment fees, and extra work to correct a faulty repair. What's left helps cover fixed overhead and profit.
Simple CLV = Expected annual contribution × Expected relationship length in years
Say a maintenance company earns $10,000 a year from a customer's service contract and spends $6,000 on parts, service visits, and other variable delivery costs. That leaves $4,000 in annual contribution. If the customer stays three years at that level, simple CLV comes to $12,000 before customer acquisition costs and fixed overhead.
To judge whether three years is realistic, the company can look at customers who began buying around the same time. For relationships that have ended, it knows how long they lasted. For customers still active, it knows how long they've stayed so far and needs to estimate the time remaining. Renewing a contract or adding another agreement doesn't restart the customer relationship.
That gives the company two ways to look at value:
- Whole-lifetime CLV covers the relationship from its beginning through its expected end, including contribution from years already completed.
- If the question is how much an existing customer might contribute from now on, the estimate should include only the contribution still expected.
So, for a customer contributing $4,000 a year throughout the relationship, total simple CLV from the start of that relationship is:
|
If the customer stays for |
Simple CLV at $4,000 a year |
|---|---|
|
2 years |
$8,000 |
|
3 years |
$12,000 |
|
4 years |
$16,000 |
The simple calculation uses a fixed annual contribution and relationship length. Contract values, service costs, and renewal chances can change over time. A fuller CLV model estimates the chance that the customer stays for each future year and discounts later cash flows to what they're worth today. That can help a service business decide how much to invest in winning or keeping an account.
10. Average service/order value
Average service/order value tells you how much revenue each distinct completed job brings in. For a repair shop, it covers finished jobs for both first-time and returning customers. That average can change even when the number of returning customers stays the same.
Average service/order value = Revenue from completed services or orders ÷ Number of those services or orders in the same period
Take the repair shop with 160 completed jobs for 100 customers over twelve months. If those jobs brought in $24,000, the average service value is $24,000 ÷ 160 = $150 per job.
A higher average bill may reflect larger repairs, which can also require costlier parts and more technician time. Looking at contribution after variable delivery costs shows whether the higher revenue per completed job leaves more to cover overhead and profit.
KPIs for customer feedback
11. Net promoter score (NPS)
Net promoter score comes from asking customers how likely they are to recommend your business on a scale from 0 to 10. Their responses fall into three groups:
- Promoters (9–10): Customers most willing to recommend you
- Passives (7–8): Customers who give middle-range scores
- Detractors (0–6): Customers who give the lowest scores
NPS = Percentage of promoters − Percentage of detractors
Say 100 customers respond to an NPS survey. Forty are promoters, 30 are passives, and 30 are detractors. NPS is 40% − 30% = +10. All 100 responses count toward those percentages, including the passives, even though they don't add to either side of the subtraction.
That positive 10 means promoters outnumber detractors by 10 percentage points among respondents. If someone who decides whether to renew a contract gives a low rating and mentions reliability, the account manager can ask what's troubling them about the relationship. A poor CSAT rating after a repair calls for a conversation about that particular job.
12. Customer satisfaction score (CSAT)
Customer satisfaction score tells you how customers rated a specific service experience, such as a completed repair. A rating of 4 or 5 on a five-point scale commonly counts as satisfied.
CSAT = (Satisfied responses ÷ All valid responses to the same question) × 100
So, if seven out of 10 respondents give a 4 or 5 to the same question about their repair, the satisfied-response rate is 70%.
Crewhu’s CSAT uses a different calculation: It subtracts the percentage of bad responses from the percentage of good ones. Okay responses stay in the total but don't add to either side of the subtraction.
That means, with seven good responses and three okay responses, the difference score is 70. Replace those three okay responses with bad ones though, and the score falls to 40. Both groups still have seven positive replies out of 10, but the second has three negative replies rather than three neutral ones. Keep that score separate from a five-point satisfied-response rate when comparing trends.
Ten survey replies from one account may point to a problem with that particular customer relationship. Ten replies from 10 different accounts, especially if they describe the same issue, may point to a wider service problem. Showing both the response count and the number of accounts helps the team see where to investigate. Ticket details and service tags can then help determine whether the complaints share a cause.
What makes a loyalty KPI result worth acting on?
A loyalty KPI result is worth acting on when it points to a specific problem the team can address or an opportunity worth pursuing. The counts behind a rate, comparisons among customers with similar service needs or contracts, and the contribution left after delivery costs all shape what the result means. A renewal rate can improve even when the number of agreements left unrenewed doesn't change.
Did contract renewals improve year-over-year?
Let’s say that, last year, a field-service company renewed 72 of the 80 agreements due, or 90%. This year, it renewed 92 of 100, raising the rate to 92%. That's 20 more renewed agreements, but also 20 more agreements up for renewal. Eight agreements went unrenewed in each year.
For three of this year's eight unrenewed agreements, customers mention late renewal offers. The manager checks the CRM records and confirms that those quotes reached customers close to when they made their decisions.
The manager then puts one person in charge of getting renewal quotes to customers earlier in the decision cycle. When the next set of agreements comes due, the team checks when the quotes arrived and how many agreements were renewed. If quotes arrive on time but customers still don't renew, their explanations may point toward another service or sales change.
What a 97% annualized NRR benchmark means
A ChartMogul analysis measured annualized NRR during 2025 among B2B SaaS companies with at least $250,000 in annual recurring revenue. The median was 82%, and the upper-quartile threshold was 97%. An annualized rate of 97% was among the stronger results in that SaaS group. It was still below 100%, the level at which the starting customers' recurring revenue would hold steady overall.
Earlier, the 10-customer MSP had 105% NRR from January through March. That's a quarterly result, so the provider can make a closer comparison with its own quarters measured the same way and, where available, recurring-service businesses with similar contracts and reporting periods.
Three customer loyalty KPI scenarios
Recurring revenue grows as one account leaves
In the MSP example, monthly recurring revenue from the original 10 accounts rises from $10,000 on January 1 to $10,500 on March 31. NRR is 105%, while GRR is 85%. One customer canceled a $1,000-a-month agreement, another reduced its package by $500, and the remaining accounts added $2,000 in monthly services.
The downgrade might mean the customer needs fewer supported employees. A smaller package could suit them, so the manager checks what changed in coverage and whether the remaining fee covers delivery costs. The canceled $1,000 account needs its own explanation.
Suppose instead the downgrade followed missed maintenance visits and the customer says it lost confidence in coverage. Ticket and visit records can show whether the promised work was missed. If they confirm those gaps, the service lead can agree on a workable schedule, track completed visits, and ask whether the customer feels confident again.
Contracts keep renewing as service satisfaction falls
Renewals at the maintenance company hold steady even as more CSAT comments mention missed updates. The account manager wants to understand what keeps customers renewing, including whether they value the service or worry about the disruption of switching providers.
One customer signed in November for an agreement due in January, then complained in December about slow ticket updates. That later complaint gives the manager a reason to ask whether the experience has changed the customer's confidence ahead of the next renewal.
On CMO Confidential, Razorfish strategist Nic Chidiac explains that repeat buying doesn't reveal why people return or what they purchase from competitors. A renewal can reflect genuine preference, tolerance of ongoing problems, or the difficulty of moving to another provider. His analysis leads to three questions:
- Why does this customer keep renewing, and which services do they buy elsewhere?
- If a credible competitor made a better offer, how ready would the customer be to move?
- How much effort would it take to renew here compared with switching providers?
See more:
Suppose the customer says they renewed because switching providers would disrupt several sites, yet they’ve already moved their after-hours support to another company. That partial move gives the account manager something concrete to investigate. The service team can fix the documented update failures while the manager looks into the after-hours decision and asks what would earn the customer's preference at the next renewal.
Repeat rate falls despite strong CSAT
A repair shop keeps getting strong CSAT ratings, but its repeat customer rate falls from 40% to 20%. In the first year, 40 of 100 customers complete a second distinct job. The next year, 40 of 200 do. The number of returning customers hasn't changed, but the shop served twice as many people overall. Many of those customers may not have needed another repair yet.
The shop looks separately at customers due for annual inspections and those who booked one-off emergency repairs during the same period. For scheduled inspections, the manager checks whether reminders were due, sent, and received. If the records confirm missed reminders, the team fixes that process and tracks completed inspections afterward. Customers whose emergency repairs solved the problem may have no reason to book again.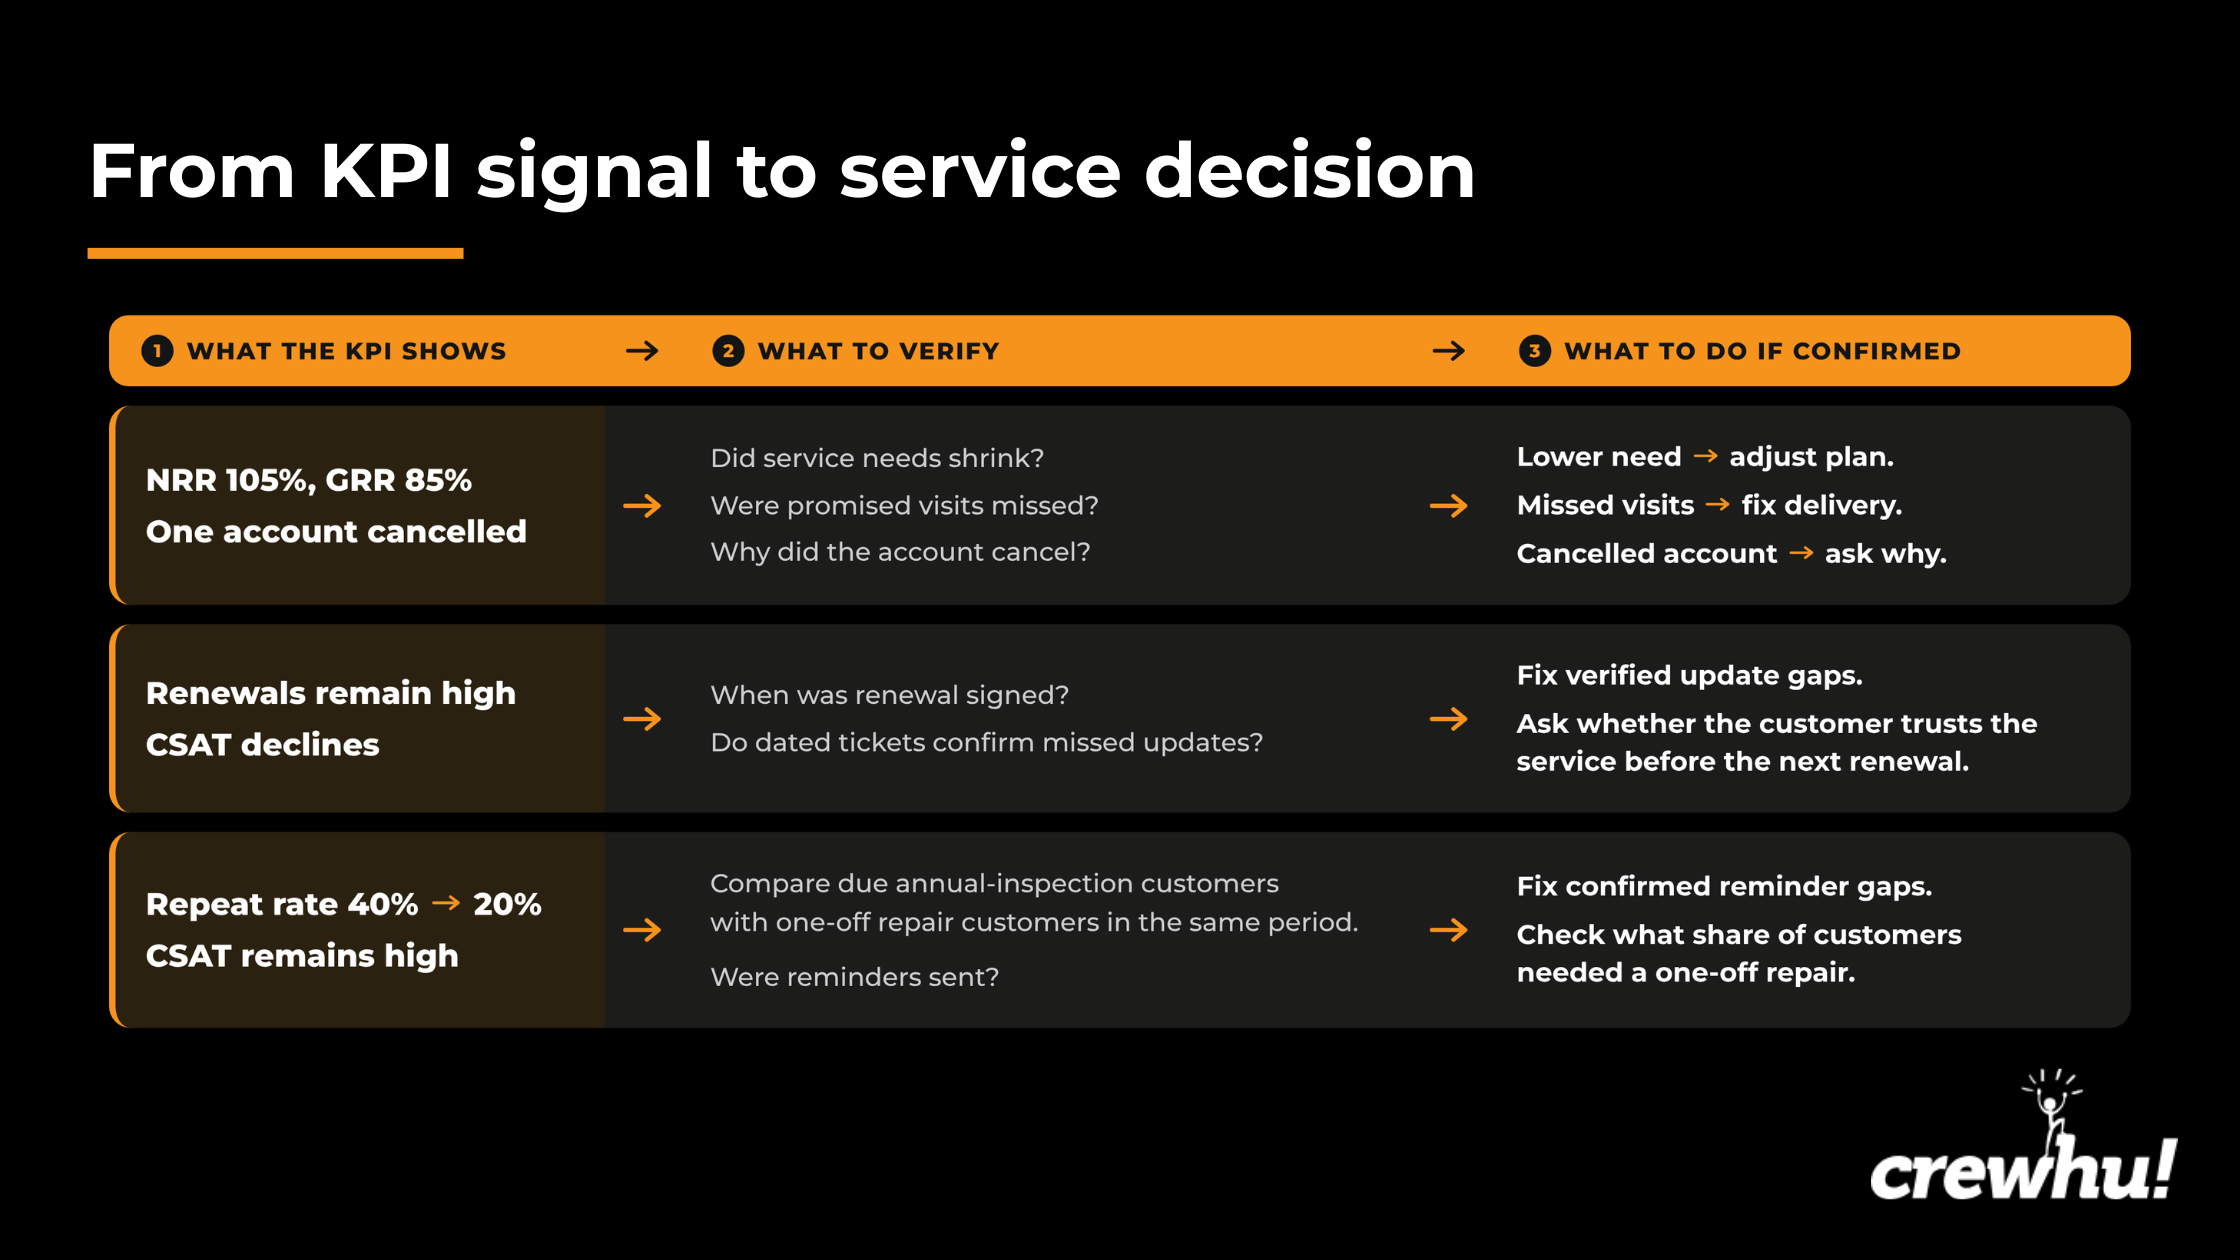
How Crewhu connects customer feedback to loyalty KPIs
Once you’ve identified a problem, such as a complaint about slow ticket updates, you need the right software to investigate. In Crewhu Pulse CSAT, you can review ratings, service tags, comments, and linked tickets where available. The Response Time tag identifies the service concern. In this case, the ticket would show an initial acknowledgment followed by days without a progress update.
After checking the record, you can then assign someone to send the next update, agree on timing with the customer, and record the commitment in the ticket. Once the team has corrected the update routine, you can tell the customer what changed in response to the complaint (if you’re responding to a Google review, you can reply directly using Crewhu Echo).
Meanwhile, Crewhu Pulse NPS can capture feedback about the wider relationship from a named contact, including any selected reasons or written comments. If someone involved in contract decisions questions the provider's reliability, the account manager can ask how the missed updates affected confidence, what the customer now buys elsewhere, and which improvements would matter at renewal.
The service lead remains responsible for the communication fix, while the account manager follows the concern about the relationship. Later CSAT responses can show how the customer rates the revised support. Follow-up NPS comments can help the manager understand whether the decision-maker's confidence has changed.
At the next due date, the contract record shows whether the customer renews the agreement. The account manager can consider that outcome alongside the service history, feedback collected before the decision, and what the decision-maker says mattered.
Leverage customer loyalty KPIs for better service decisions
One canceled account can sit behind a 105% NRR, and a falling repeat rate may come from serving more one-off repair customers. Those results call for a closer look at the customer records, the work delivered, and the contribution left after costs. Where feedback and service history point to a problem the team can confirm, it can make a change and then follow the next renewal or completed job to see what customers chose.
Book a Crewhu demo to see how Pulse CSAT and Pulse NPS help teams collect customer feedback, find the accounts behind a concern, and follow up on what customers experienced.
FAQs about customer loyalty KPIs
Do I need a loyalty program to measure customer loyalty?
No. Contract records and separately completed jobs show whether customers renew or return. Feedback shows how they experienced the service, and contribution after delivery costs shows the financial value of continuing business. If the business runs a loyalty program, membership and redemption records help explain how customers use it.
How often should I review customer loyalty KPIs?
Review service feedback and open tickets as they come in. For a busy service team, monthly or quarterly trends can reveal patterns when there are enough relevant survey responses or completed jobs for the metric you're tracking. When relatively few annual contracts come up for renewal, a rolling 12-month view can give a clearer picture. Keep the actual response, job, and agreement counts alongside the rates.
What if one customer has several locations or contracts?
If one customer has three agreements due and renews two, the agreement renewal rate is (2 ÷ 3) x 100 = 66.7%. The customer may still count as one active account if a qualifying agreement remains in force. A stable customer ID keeps each location and agreement connected without counting the company several times.
Can a small service business start with a spreadsheet?
Yes. Start with customer IDs, unique completed-job IDs, completion dates, and revenue. Keep multiple visits to finish the same repair under one job ID. From those records, you can count how many customers had at least one completed job, how many returned for another, and how much revenue all completed jobs generated. That's enough to calculate a basic repeat customer rate and average service value without specialized reporting software.