Key Takeaways
- To see where you stand in your customer relationships, compare ACSI or UKCSI scores with similar providers in the same index program. Keep your custom CSI questions and scoring consistent to track changes in your own service.
- Choose your weights before reviewing the results.
- When customers rate the clarity of updates poorly, check the messages they received and how your team handled each handoff. Make a targeted change, then measure clarity again.
- Satisfaction is more closely linked to customers' plans to stay than to actual retention. Compare survey feedback with completed renewals, repeat bookings, and purchases to see who stayed or came back.
Customer satisfaction helps you gauge the health of your relationship with your clients, but quantifying sentiment requires a bit of math. A customer satisfaction index (CSI) brings customer survey answers together in a score you can track over time. When that score moves, you should dig into the individual responses to get a clearer picture of what customers experienced.
What Is the Customer Satisfaction Index?
A customer satisfaction index measures how satisfied customers are with a business or service, using their survey ratings to calculate a score. A service business can either use a reputable, pre-existing index or create its own from customer ratings of timeliness, communication, and problem resolution.
Picture an IT support customer whose issue is fixed correctly but then waits a long time for an update. They may be happy with the fix and frustrated by the communication. A single satisfaction question tells you how they felt about the service overall, while a few focused questions show how they rated each part of the job. That’s how you learn where your strengths and weaknesses are.
Customer satisfaction score (CSAT) is the percentage of survey respondents who give a positive answer to a satisfaction question. A CSI of 75 points is an index score, not a finding that 75% of customers were satisfied. Meanwhile, net promoter score (NPS) asks how likely a customer is to recommend the company. All three are used to gauge customer opinions about your business but in different ways.
For an industry comparison, use a published index with relevant peers. To keep an eye on your own service, ask consistent questions and score them the same way over time. After a single support ticket, one quick CSAT question may be enough.
How Do the ACSI and UKCSI Models Measure Satisfaction?
ACSI and UKCSI both report customer satisfaction on a 0–100 scale, but they build their scores differently. ACSI combines three satisfaction ratings, while UKCSI uses more than 25 measures across five areas. That means an 80 in one index doesn't mean the same thing in the other.
The American Customer Satisfaction Index model asks customers to rate their overall satisfaction, how the experience measured up to expectations, and how close it came to an ideal experience. Researchers estimate how much each rating contributes to the published score rather than simply averaging the three answers.
Imagine a home cleaning crew that leaves the place spotless. The customer might rate the visit highly overall, but the crew arrived an hour later than promised, so the experience fell short of expectations. And because no one sent an update, the customer had to call to find out what was happening. Their ideal visit would've combined the excellent cleaning with an on-time arrival and clear communication.
ACSI also examines factors that may influence satisfaction, including expectations, perceived quality, and perceived value, along with outcomes such as complaints and loyalty. If customers rate quality poorly, check how reliably the service is delivered and whether the work meets their needs. If value is the weak spot, find out whether they feel they're getting their money's worth.
How UKCSI differs from ACSI
The UK Customer Satisfaction Index (UKCSI) uses more than 25 measures across five areas: experience, complaint handling, customer ethos, emotional connection, and ethics. Customer ethos captures whether people feel the organization cares about their needs. UKCSI weights its measures according to customer priorities.
|
Index |
How the score is built |
Useful comparison |
|
ACSI |
Overall satisfaction, comparison with expectations, and closeness to an ideal experience, combined using model-estimated weights; 0–100 |
ACSI results for comparable groups and reporting periods |
|
UKCSI |
25+ measures across experience, complaint handling, customer ethos, emotional connection, and ethics, weighted by customer priorities; 0–100 |
UKCSI results measured on the same basis |
|
Custom service CSI |
Service questions and weights chosen by the business, with scores calculated using its own method; 0–100 |
Your own earlier results using consistent questions, rating scales, scoring, and weights |
How to Calculate a Custom Customer Satisfaction Index
To calculate your own CSI, average the ratings for each survey question, convert those averages to a 0–100 scale, and combine the scores using weights you've chosen in advance.
Suppose an MSP surveys four customers after completing their jobs. It asks them three questions:
- How would you rate the timeliness of our service?
- How would you rate the clarity of our updates?
- How would you rate the quality of the resolution?
Customers rate each one from 1 to 5, where 1 is very poor, 2 is poor, 3 is fair, 4 is good, and 5 is excellent.
One customer skips the resolution question, leaving 11 ratings from four customers, as shown below. The dash means the customer didn't answer, so there's no score to include for that question.
Answers from four customers and the scores they produced:
|
Response or result |
Timeliness |
Clarity |
Resolution |
|
R1 |
4 |
3 |
5 |
|
R2 |
3 |
4 |
4 |
|
R3 |
5 |
2 |
5 |
|
R4 |
4 |
3 |
— |
|
Valid responses |
4 |
4 |
3 |
|
Exact mean |
4 |
3 |
14/3 |
|
Score on 0–100 scale |
75.00 |
50.00 |
91.67 |
Calculate the score for each question
Each question gets its own average, based on the customers who answered it.
- For timeliness, that's (4 + 3 + 5 + 4) ÷ 4 = 4.
- Clarity comes to (3 + 4 + 2 + 3) ÷ 4 = 3.
- Resolution has only three ratings, so you divide by three: (5 + 4 + 5) ÷ 3 = 14/3, or approximately 4.67.
Now, you need to convert those averages to a common 0–100 scale. For the five-point survey, the calculation is:
Score for each question = 100 × (Average rating − 1) ÷ (5 − 1)
This puts the lowest possible rating, 1, at zero and the highest, 5, at 100. The results are 75 for timeliness, 50 for clarity, and 91.67 for resolution. (We'll keep the exact resolution average of 14/3 for the remaining calculations so rounding doesn't throw off the total.)
Choose how much each question counts
With equal weights, each question contributes one-third of the CSI. Using the three converted scores yields:
- Equal-weight CSI = (75 + 50 + 91.666…) ÷ 3 = 72.22
Each question has the same influence on the index, even though three customers answered the resolution question and four answered the other two.
Now, imagine the business had chosen a different weighting system before collecting the survey results: 30% for timeliness, 20% for clarity, and 50% for resolution. Here's what happens when we apply those weights to the exact same answers:
- Custom index = (0.30 × 75) + (0.20 × 50) + (0.50 × 91.666…) = 78.33
That's an increase of 6.11 points, without a single customer changing their answer. The second formula puts more emphasis on resolution, which happens to be the highest-rated part of the service.
Equal weights are a sensible starting point when you don't have evidence that one aspect matters more to customers. If customer research gives you a good reason to emphasize resolution, speed, or communication, you can choose weights that reflect those priorities.
Decide on and document the weights before you look at the results. Keep the questions, scoring, and weights consistent over time. If you change the method, recalculate earlier scores before comparing them with the new ones.
Read the ratings behind the total
Going back to the earlier example, clarity averages 3 out of 5, or 50 on the converted scale, while resolution scores 91.67.
That gap is worth investigating. Did updates arrive when promised? Did customers know what would happen next, or did they have to chase the team for answers? Customer comments and sent-message records can help a service manager see what happened.
Resolution's 91.67 score comes from only three answers, but imagine R4 had answered that question, too, giving it a 1. The resolution average would then be (5 + 4 + 5 + 1) ÷ 4 = 3.75, producing a converted score of 68.75.
This shows how much one extra answer can move a score when the sample is small. Keep the number of valid responses visible alongside the scores so you can judge how much information sits behind each result.
What Is a Good CSI Score?
A good CSI score depends on a fair comparison. Look at how your results have changed over time, how similar providers score in the same published index, and what's happening behind your overall number:
- Check your own trend: Compare similar customers and service jobs across reporting periods, using the same questions and scoring method.
- Compare like with like: For ACSI and UKCSI, choose similar providers within the same index program and compare results from comparable reporting periods. For a custom CSI, your own past results are the better yardstick.
- Look beneath the total: Timeliness might improve while clarity drops, leaving the overall CSI almost unchanged. Compare each question to its own earlier ratings to see what's moving.
As a guest on “The Modern Customer Podcast,” Forrest Morgeson, director of research at ACSI, discussed the reasons behind a 3% year-over-year rise in overall airline satisfaction. Reservation ease, mobile-app reliability, and even seat comfort scored better too. The overall increase came alongside higher ratings across several parts of the journey.
See more:
Who answered the survey matters as well. Suppose this month's responses include more customers served by a team that usually gets higher ratings. The company-wide average could climb even if each team's scores stayed steady. Report how many people responded and which customer groups they came from, following survey-transparency guidance from the American Association for Public Opinion Research.
Customer Satisfaction Index Example: CPS Energy
CPS Energy, which supplies electricity and natural gas to San Antonio, Texas, saw its ACSI score climb from 62 in 2022 to 79 in 2026. That's a 17-point increase, documented in ACSI's 2026 retrospective case study. The final score was also five points above the municipal-utility average of 74 for the same year.
According to ACSI, benchmarking and customer feedback helped CPS Energy focus on reliability, affordability, and support during disruptions. The company invested in infrastructure to make service more dependable, helped customers find bill-assistance programs, and provided on-the-ground support during outages. It also sent severe-weather alerts to keep customers informed. Listening to and addressing customer needs drove that score increase.
How Customer Satisfaction Relates to Retention
Customer satisfaction is more strongly linked to customers' intention to stay rather than whether they actually stay. In fact, an analysis published in Marketing Letters: A Journal of Research in Marketing found a stronger association with intended retention than with observed retention. A happy customer can still leave after a budget cut, while someone who's unhappy might renew anyway because switching providers would disrupt their business.
For ongoing contracts, match feedback gathered before a renewal with the customer's actual decision once the renewal date has passed. If customers book services as needed, check their completed repeat bookings or purchases after the survey to see who came back.
If satisfaction is rising while renewals are falling, look at the accounts involved. Prices may have gone up, contract terms may have changed, or customers may need something different from the service now.
How to Use CSI Results to Improve Customer Service
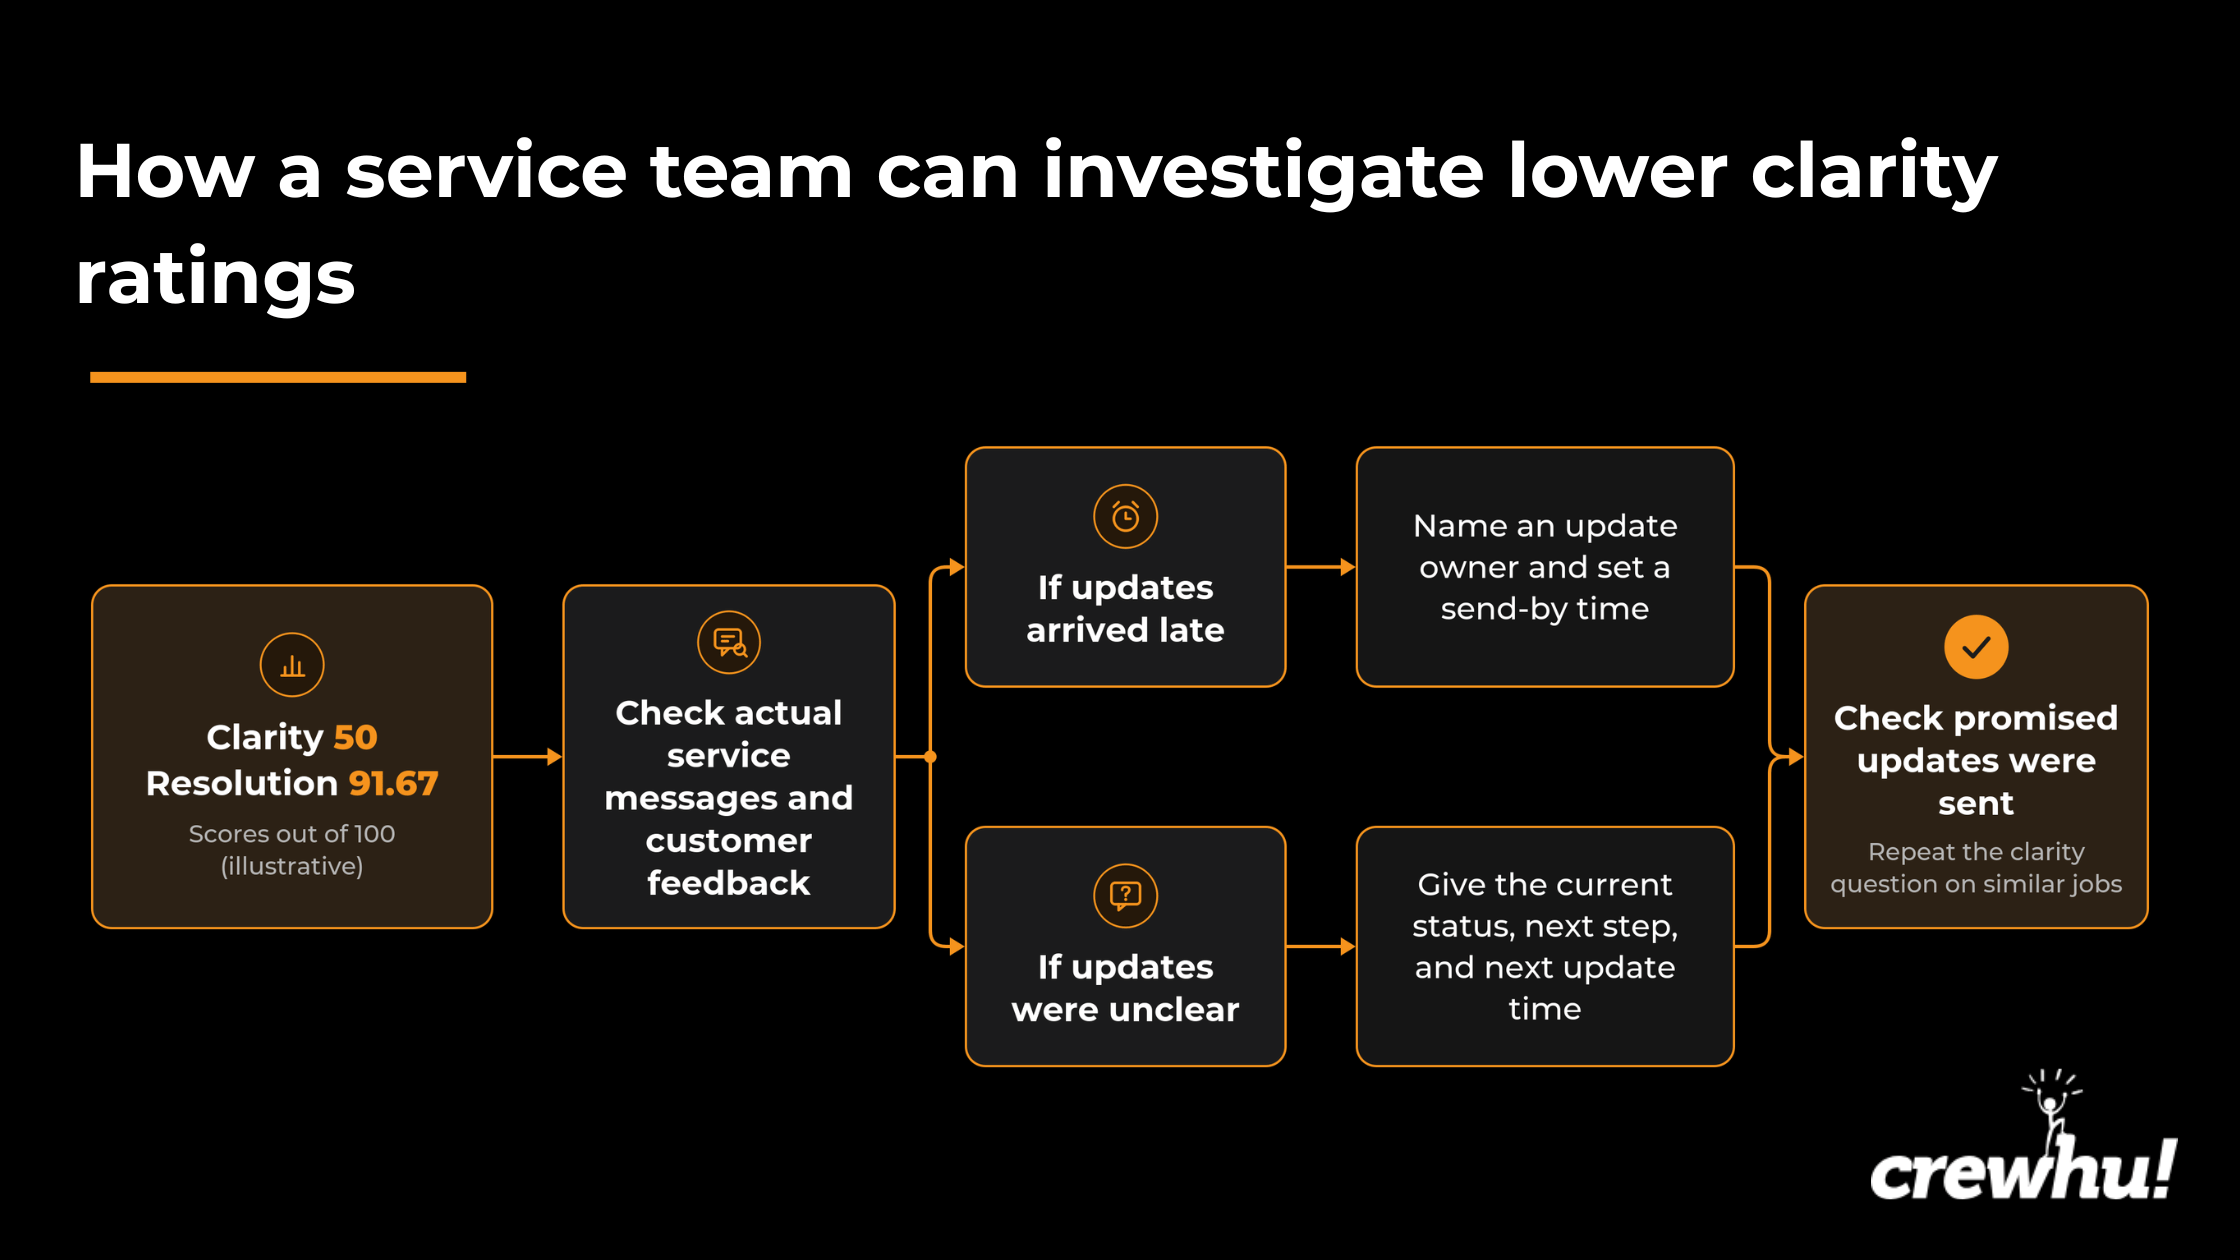
- Find the jobs behind low clarity ratings. In our example above, clarity scored just 50 while resolution reached 91.67. Open the tickets or service records behind similar feedback and see which jobs customers were rating. Group the responses by service type, team, or account, and note how many customers answered in each group.
- Check what customers actually received. Compare their comments with ticket notes and the times your team sent updates. If the records don't explain the complaint, ask a few customers directly. Did the update arrive late? Or, did it arrive on time without telling them what would happen next?
- Fix the specific problem. If updates are late, name the person responsible for the next message and set a send-by time. If the messages are unclear, include the current status, the next step, and when the customer should expect another update. Have a service lead check that the team follows through.
- Check that the change happened. Review the next batch of tickets. Were promised updates actually sent? Where possible, confirm that customers received and understood them. If the new process isn't being followed, correct that first.
- Measure clarity again. Keep the same survey question and compare similar service jobs. Look at the new ratings, comments, and response counts. If you track status-related follow-ups, check whether fewer customers have to contact the team just to find out what happens next.
Crewhu's transactional CSAT reports help service managers investigate feedback from individual jobs. They can choose a customer and a period, such as the previous quarter. If customers left comments or selected tags about communication, those responses point to tickets worth checking. Grouping feedback by employee and tag gives a service lead specific cases to discuss during coaching.
Once the team changes how it handles updates, the Pulse CSAT dashboard can help compare feedback from similar customer groups before and after the change. For a closer look, Crewhu’s CSV export options or Open API can supply available survey responses for a separate analysis alongside message timestamps from the service desk. The service lead can then check if updates went out as promised and whether customers rated communication differently afterward.
Customer satisfaction is more than just a feeling
Your customer relationship doesn’t end once they sign a contract with you. You want to keep the clients you secure, rather than have to hunt for new ones constantly. That’s why it’s crucial to calculate and review satisfaction numbers regularly to ensure you’re aren’t driving them away unknowingly.
The same ratings from the same customers can produce a different CSI depending on what variable gets more weight. Keep the questions, scoring, and weights consistent before interpreting a change.
Low clarity ratings point you toward the messages customers received. Check those records, fix late or confusing updates, and see whether later feedback changes on comparable jobs. Track completed renewals, repeat bookings, and purchases separately to find out which customers stayed or came back.
If poor feedback about customer updates or handoffs keeps coming up, book a Crewhu demo to explore CSAT reporting and coaching tools that can help your team investigate those service problems.