
Key Takeaways
- Employee productivity metrics calculate how much of a team’s time and effort leads to completed work.
- Without a proven system, managers tend to rely on a single metric or gut feeling. The DMAIC method (define, measure, analyze, improve, control) gives MSPs a repeatable way to fix one process at a time and confirm the solution worked.
- No single number tells the full story. To get reliable employee productivity measures, combine speed and volume metrics with quality checks.
- Avoid traps like fast ticket closures that create additional work for the service desk. Industry benchmarks help standardize metrics, while your own baseline is the better yardstick for the rest.
- Metrics need to be visible to the people doing the work to improve performance, which is where feedback, recognition, and coaching come in.
It’s normal to wonder if your team is genuinely productive or just busy. Ticket queues can look full, calendars packed, and utilization reports healthy, but none of that tells you if the work being done is moving the business forward.
To gauge productivity, don’t rely on personal impressions or gut feeling. You need concrete numbers, and that’s what employee productivity metrics are for. They turn, "We feel busy," into something you can actually measure and improve.
What Are Employee Productivity Metrics?
Employee productivity metrics quantify how efficiently employees turn their time and available resources into finished work while maintaining service quality and delivering value to clients. It’s not about simply closing more tickets or working faster. For MSPs and other service businesses, it’s meant to show whether technician work produces lasting, satisfactory results.
Employee Productivity Measurement Considerations
A basic estimate of employee productivity in customer service is:
Productivity = Output ÷ Labor hours
So, a technician who resolves 30 tickets in 40 working hours averages 0.75 resolved tickets per hour.
However, this estimate doesn’t tell the whole story. Ticket counts alone can be misleading, and complex incidents require more effort than simple password resets. That’s why service businesses need to compare similar ticket categories and account for severity, responsibilities, and experience.
Depending on what you’re trying to analyze, it’s smart to pair output metrics with quality indicators. This could mean adding reopen rates, first-contact resolution, SLA compliance, and customer satisfaction. And that’s just for tickets; other areas like onboarding, account management, and NOC have their own way of calculating productivity.
Since there are numerous factors to take into account and various situational exemptions to be made, it’s difficult to boil productivity down to a single number. It’s better to focus on a specific problem that’s hurting productivity and find related productivity metrics that quantify it so companies can then find relevant solutions.
Focus on the problem
A reliable productivity review requires following a system. Value comes from knowing what combinations of metrics to use and then comparing and interpreting them using the same parameters.
Managers tend to fall back on one of two habits: Either they tie themselves to a single metric like tickets closed, utilization, or hours logged and end up rewarding whatever that number captures while quality, morale, or client experience slips out of view; or they go by gut feeling.
Neither approach points to what's actually wrong, so the fixes that follow (e.g., more oversight, longer hours, another tool) miss the root cause. MSPs need a repeatable way to pinpoint a specific problem, fix it, and confirm the solution worked.
A practical option is the DMAIC methodology, which breaks down improvement into five stages:
- Define (Identify the problem)
- Measure (Establish baseline metrics)
- Analyze (Identify root causes)
- Improve (Implement targeted solutions)
- Control (Sustain the improvements)
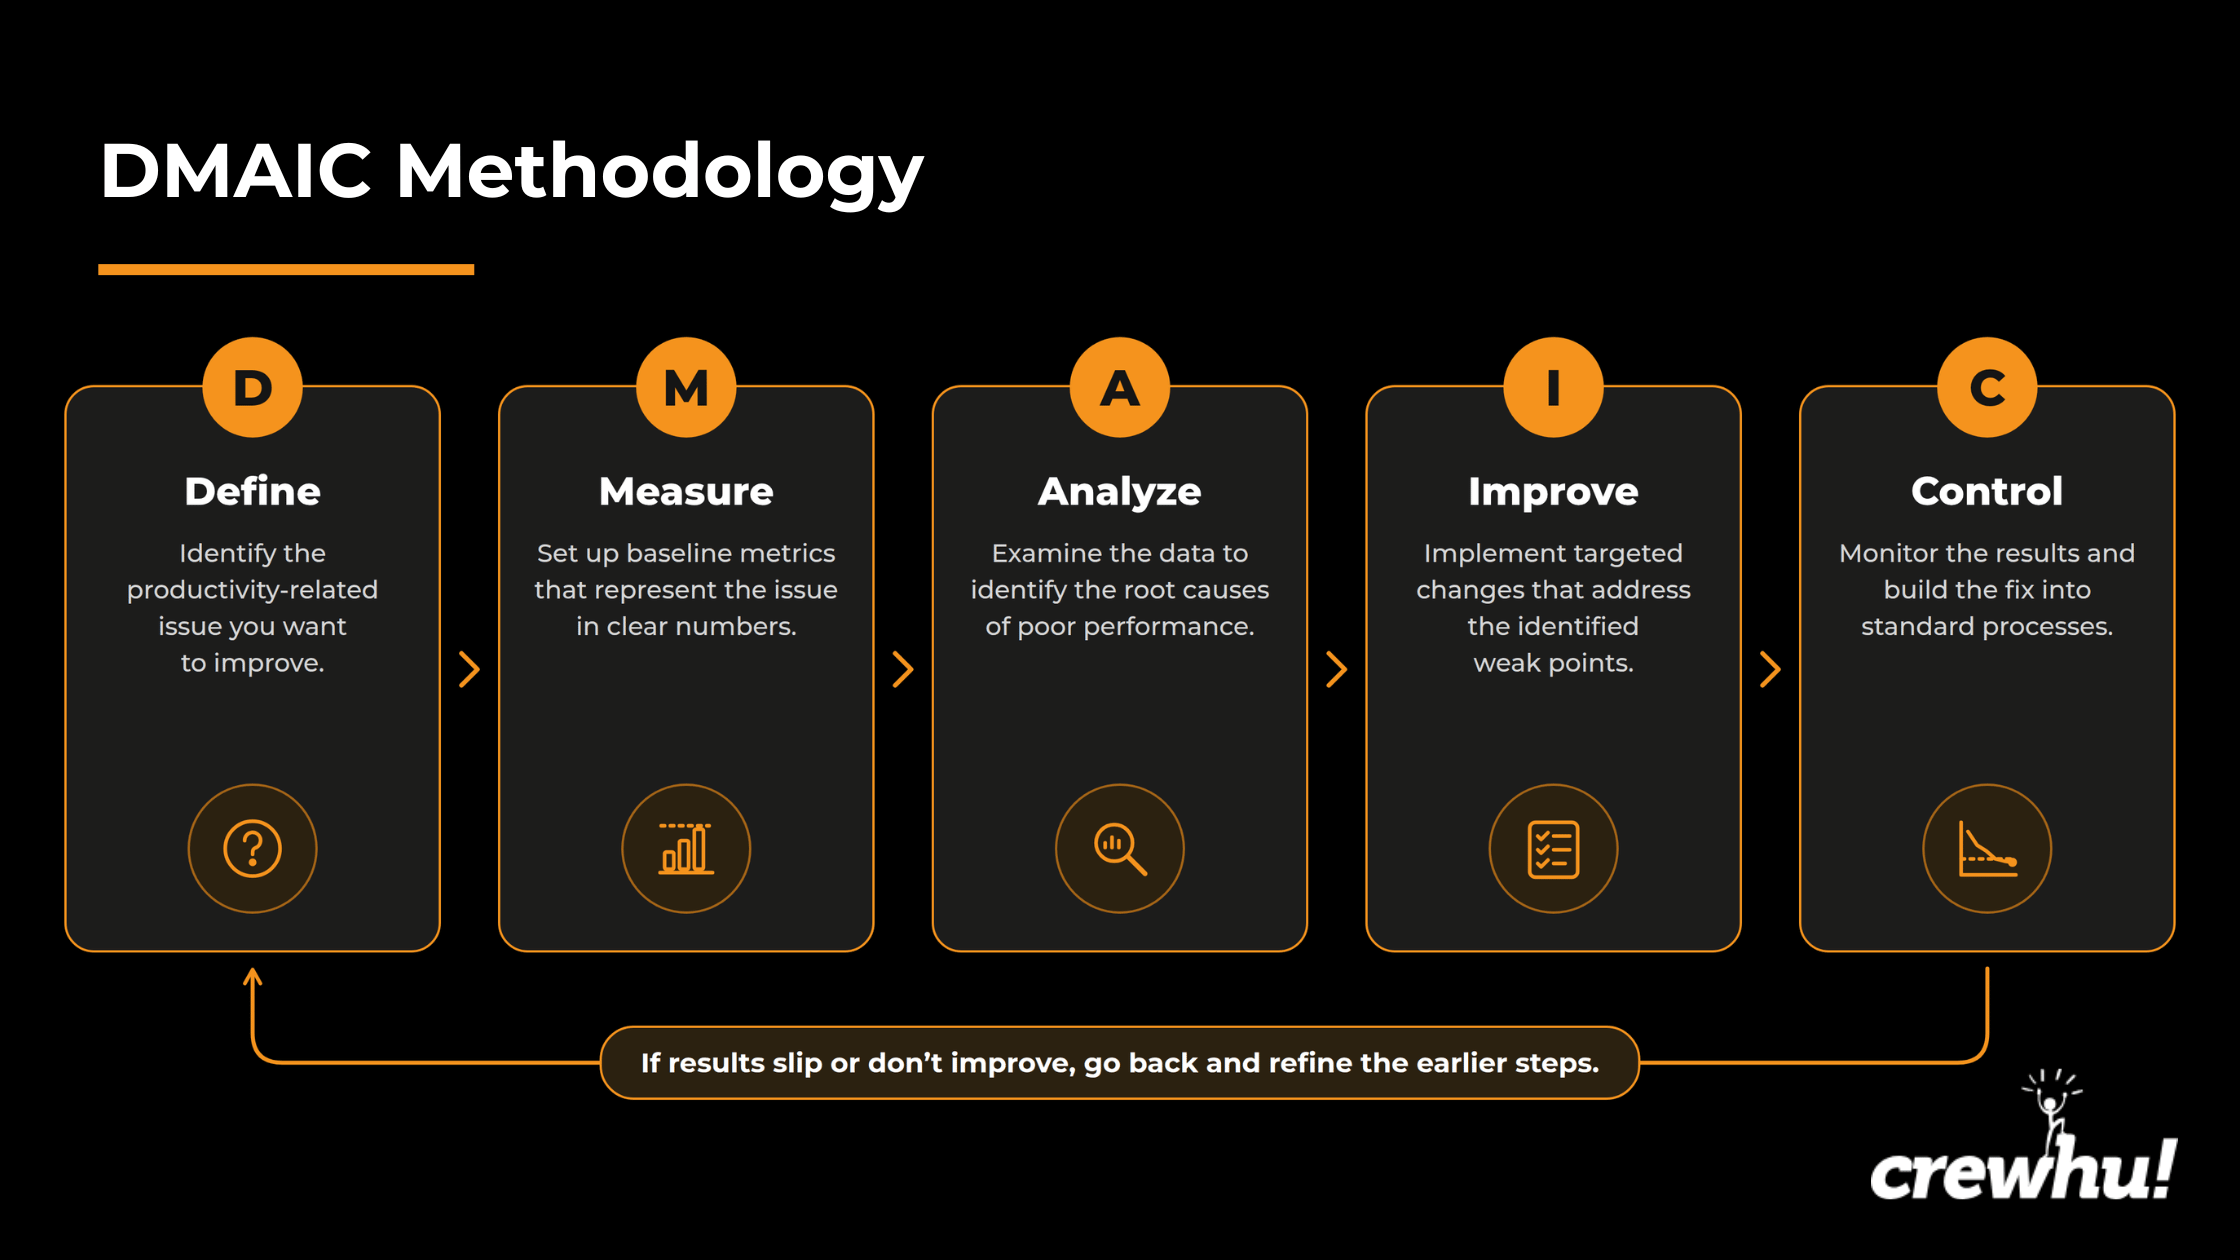
One of the biggest benefits of DMAIC is the focus it brings. Instead of trying to improve everything at once, this method points the team at one process at a time. It also replaces opinion with hard evidence. The measure and analyze stages give you both a baseline and a root cause so a shift in tickets closed or MTTR can be traced to a specific reason rather than having to guess. In fact, according to research from De La Salle University, applying the DMAIC methodology slashes the MTTR by 39%.
It also protects against false wins, since every cycle ends by checking if the change worked and whether the success or failure is related to the changes made.
Managers who understand DMAIC can ask better questions like: What is the root problem? What does the baseline say? What's driving it? It also gives them a shared language for explaining priorities to technicians and justifying changes to owners using concrete data instead of assumptions.
Specific Employee Productivity Metrics Examples
Employee productivity metrics capture a different part of how work gets done, so service businesses should combine metrics to gain a complete picture.
Time-based metrics
Time-based metrics measure how long work takes. They're some of the easiest KPIs to collect but also to misinterpret. A technician getting through work faster isn't necessarily more productive if quality suffers as a result.
The most commonly used time-based metrics are:
- Average Time per Ticket: Average labor time spent handling a ticket
- Response Time: Time span between a ticket creation and the first meaningful response
- Resolution Time: Time between a ticket creation and resolution
- Backlog Aging: How long unresolved work remains open
- Cycle Time: The time between starting a task and finishing it.
Output-based metrics
Output-based metrics measure how much work employees or teams complete over a given period. They're useful for tracking throughput, but volume should be paired with a quality metric to ensure one is sacrificed to boost the other.
The most commonly used output-based metrics are:
- Tickets Closed: Number of tickets resolved or closed
- Project Tasks/Milestones Completed: Amount of planned project work completed
- Backlog Reduction: Change in the amount of outstanding work
- Documentation Completed: Knowledge base articles, SOPs, client documentation, and other required records created or updated
- Preventive Tasks Completed: Patching, maintenance, audits, reviews, and other proactive work completed
Efficiency and quality metrics
These metrics show how much available time and resources are converted into satisfactory work. They can also reveal if a seemingly strong output is creating extra work elsewhere.
The most commonly used efficiency and quality metrics are:
- Technician Utilization Rate: Percentage of available working time spent on client work
- First Contact Resolution (FCR): Percentage of issues resolved during the initial interaction
- First-Time Fix Rate: Percentage of onsite jobs resolved without requiring another visit
- Rework Rate: Percentage of completed work that has to be corrected or repeated
- Escalation Rate: Percentage of work requiring escalation to another technician or tier
- Automation Rate: Percentage of eligible work completed or avoided through automation
- Actual Versus Budgeted Hours: Actual labor required compared with the amount originally estimated
Collaboration metrics
Some work depends on more than individual output. Collaboration metrics look at how effectively knowledge and work move between technicians, teams, and departments.
The most commonly used collaboration metrics are:
- Ticket Transfer Rate: How frequently work changes owners before resolution
- Knowledge Base Contribution and Reuse: Whether employees create useful shared knowledge and whether that knowledge is subsequently used
- Handoff Quality: How completely and accurately work is transferred between employees or teams
- Quality Documentation Completeness: Percentage of required documentation completed correctly, particularly during project-to-support and onboarding handoff.
Customer-linked metrics
Customer-linked metrics determine if internal productivity translates to a better client experience. They’re particularly useful as counter-metrics to speed and output; closing more tickets isn't a productivity gain if customers have to come back for the same problem.
The most commonly used customer-linked metrics are:
- CSAT: Customer satisfaction following a service interaction
- Customer Effort Score (CES): How easy it is for customers to resolve an issue
- Reopen Rate: Percentage of supposedly resolved cases that require additional work
- Ticket Recurrence: How frequently the same or similar problems return
- Client Retention/Renewal Rate: Percentage of clients that remain with the company or renew their contracts
MSP Benchmarks
Industry-wide benchmarks should be used only for guidance in service businesses. Metrics like tickets closed, escalation rate, documentation completed, and project milestones completed depend heavily on ticket complexity, technician responsibilities, and service delivery models. Applying universal targets here can encourage misleading comparisons or reward quantity over quality.
When comparing your results to these benchmarks, take other factors into account like service scope, scale, technical complexity, and geography. It’s better to establish internal baselines for highly context-dependent metrics and compare their progress over time.
That being said, some service desk metrics benefit from external benchmarks. We’ve pulled industry benchmarks from BMK Community and Codestra Aquant to give you a baseline.
Metric
Benchmark
First-Time Fix Rate
77% industry benchmark; top 20% reach 88%
Technician Utilization Rate
75% suggested target; above 85% may indicate overutilization
Customer Satisfaction (CSAT)
85%–95% recommended range
These three metrics are good options for industry-wide benchmarking because they measure relatively standardized aspects of service efficiency, resource utilization, and customer experience. That allows for meaningful comparisons between MSPs when measurement methods and operating conditions are similar.
Even so, MSPs should combine relevant industry benchmarks with their own historical data. The goal is to identify meaningful improvements without compromising service quality.
Employee Productivity Metrics by Team and Function
Employee productivity means different things to different teams in a service business. So, when going over various metrics, look at them at the team level and determine what role they play and how they combine with each other to reduce confusion and ambiguity.
Service desk and technicians
The service desk is the front line of an MSP. This team handles a high volume of support requests, resolves what it can, and escalates what it can’t. For these employees, productivity comes from combining speed with accuracy, so combine their respective metrics to gauge service desk and technician productivity.
Common metrics: Tickets closed, average time per ticket, first response time, resolution time, first contact resolution, reopen rate, backlog, technician utilization, and CSAT.
Common metric combinations:
|
Metric combination |
What it tells you |
|
Tickets Closed + Reopen Rate |
Whether higher output is actually producing completed work or simply creating rework |
|
Average Time per Ticket + First Contact Resolution |
If technicians are working efficiently while still solving problems on the first interaction |
|
First Response Time + Resolution Time |
Whether clients are getting both a quick acknowledgement and a timely solution |
|
Technician Utilization + CSAT |
If you're making good use of technician capacity without service quality suffering |
|
Backlog + Ticket Age |
Whether the queue is genuinely under control or older tickets are getting stuck |
Your fastest technician can be a model for the rest of the team as long as speed and quality stay equal. A tech who consistently closes tickets in record time is a top performer when those tickets stay closed. Comparing average time per ticket with reopen rate and subsequent ticket activity shows if speed is actually reducing the team’s workload.
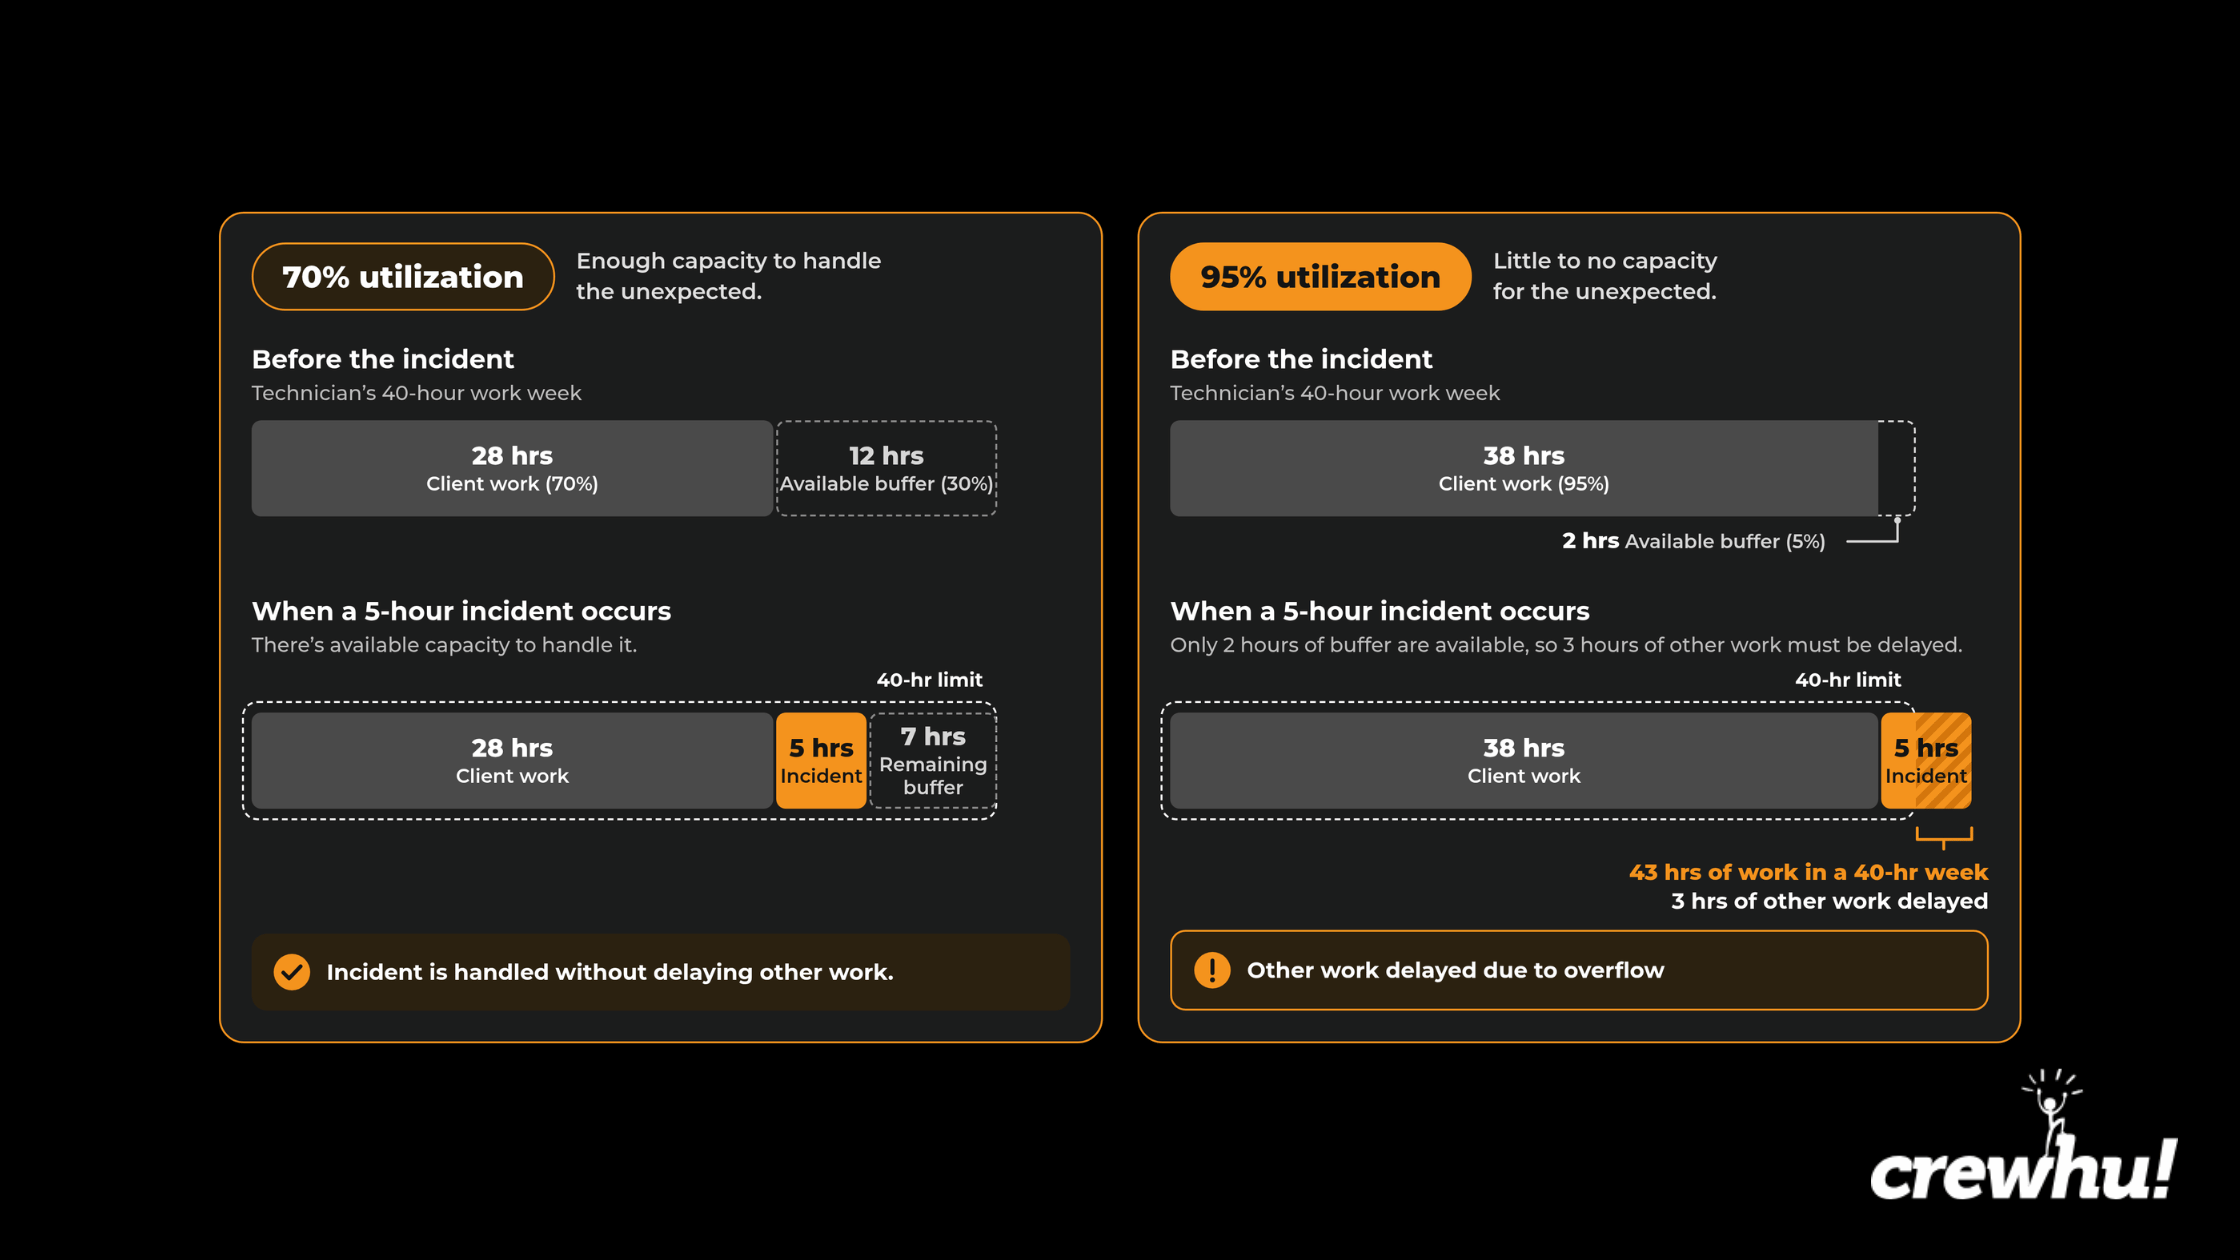
Leave some breathing room in the utilization rate. That way, a service desk with spare capacity can absorb a major client outage and keep response times steady, while one running near full capacity may see them slip quickly. Bennett Financials specifically recommends a 65% utilization rate for performers; 85% risks burnout. Utilization targets should account for unpredictable demand, documentation, training, and escalations rather than treating every unallocated hour as wasted time.
Project and onboarding teams
Project and onboarding teams handle planned, scoped work such as migrations, deployments, infrastructure upgrades, and bringing new clients into the MSP's environment. Unlike the service desk, raw volume matters less here. Productivity is about completing the agreed-upon work on time and within budget without creating rework or leaving problems for the service desk after handoff.
Common metrics: Project completion rate, milestone completion, actual versus budgeted hours, schedule variance, rework rate, documentation completeness, and client satisfaction.
Useful metric combinations:
|
Metric combination |
What it tells you |
|
Milestone Completion + Schedule Variance |
Whether projects are progressing as planned rather than simply checking off tasks |
|
Actual vs. Budgeted Hours + Project Completion |
If completed work required the amount of labor originally expected |
|
Tasks Completed + Rework Rate |
Whether high output represents finished work or work that needs to be corrected later |
|
Documentation Completeness + Post-Handoff Issues |
If projects are being handed to the service desk cleanly |
|
On-Time Delivery + Client Satisfaction |
Whether hitting the deadline also produced an outcome the client is happy with |
А successful onboarding doesn’t end at sign-off. An onboarding team might complete every milestone, obtain client approval, and close the project on time. Complete documentation, correct configurations, and thorough handoffs are what keep support tickets low long after launch. Info-Tech Research Group's research even identifies poor knowledge transfer and incomplete documentation as key contributors to unstable launches and spikes in support tickets. Tracking post-handoff issues alongside documentation completeness helps MSPs confirm that onboarding delivered a sustainable result rather than merely finishing a checklist.
Project completion rate only tells the full story when it’s paired with complexity. A team completing 10 simple deployments and a team handling two complicated, high-value migrations are both productive, just in a different way. Consider project complexity and business value alongside completion rates rather than treating every finished project as an equal contribution.
On-time delivery is most reliable when paired with cross-team effort. A migration might finish on schedule because senior service desk technicians pitched in repeatedly. While this is great teamwork, it needs to be accounted for. If the service desk’s backlog grows and client response times slip as a result, though, the true cost is hidden. Track cross-team resource consumption, alongside the deadline, to capture the full picture.
Account management and customer success
Account managers own the ongoing client relationship rather than individual ticket resolution. Their job is to keep clients engaged, understand changing needs, follow through on commitments, and, ultimately, protect and grow the relationship. To judge their productivity, look beyond emails and meetings and rather observe how activity translates into healthier accounts.
Common metrics: QBR completion, action item completion, client touch points, CSAT, renewal rate, client retention, account growth, and churn.
Common metric combinations:
|
Metric combination |
What it tells you |
|
Client Touch Points + Action Item Completion |
Whether client conversations actually lead to follow-through |
|
QBR Completion + Renewal Rate |
If regular strategic reviews are associated with stronger client relationships |
|
CSAT + Churn |
If satisfied clients are actually staying with the MSP |
|
Account Growth + CSAT |
Whether expansion is creating value without damaging the relationship |
|
Account Manager Activity + Churn |
Whether a high level of activity is translating into healthier accounts rather than just more meetings and emails |
High satisfaction is a strong start, but it doesn’t guarantee renewal. Corsica Technologies 2026 Trust Gap Report found that 87% were satisfied with their MSP’s, and yet 65% were considering switching within 12 months. Comparing CSAT with churn and account-level risk indicators provides a more complete picture of client relationships.
Field and onsite technicians
Field technicians handle work that requires someone to be physically at the client's location, from hardware installation and troubleshooting to network work and equipment replacement. Because every dispatch involves travel, scheduling, and technician time, productivity depends heavily on getting as much value as possible from each visit, ideally without having to send someone back.
Common metrics: First-time fix rate, jobs completed, time on site, repeat visit rate, travel time, technician utilization, SLA compliance, and CSAT.
Common metric combinations:
|
Metric combination |
What it tells you |
|
Jobs Completed + First-Time Fix Rate |
If technicians are completing a high volume of visits while actually solving the problem |
|
Time on Site + First-Time Fix Rate |
Whether shorter visits are efficient or rather provide rushed or incomplete work |
|
First-Time Fix Rate + Repeat Visit Rate |
Whether problems stay fixed after the technician leaves |
|
Travel Time + Productive Time |
How much of the technician's working day is actually available for client work. |
|
SLA Compliance + CSAT |
If arriving within the promised window also results in a good client experience |
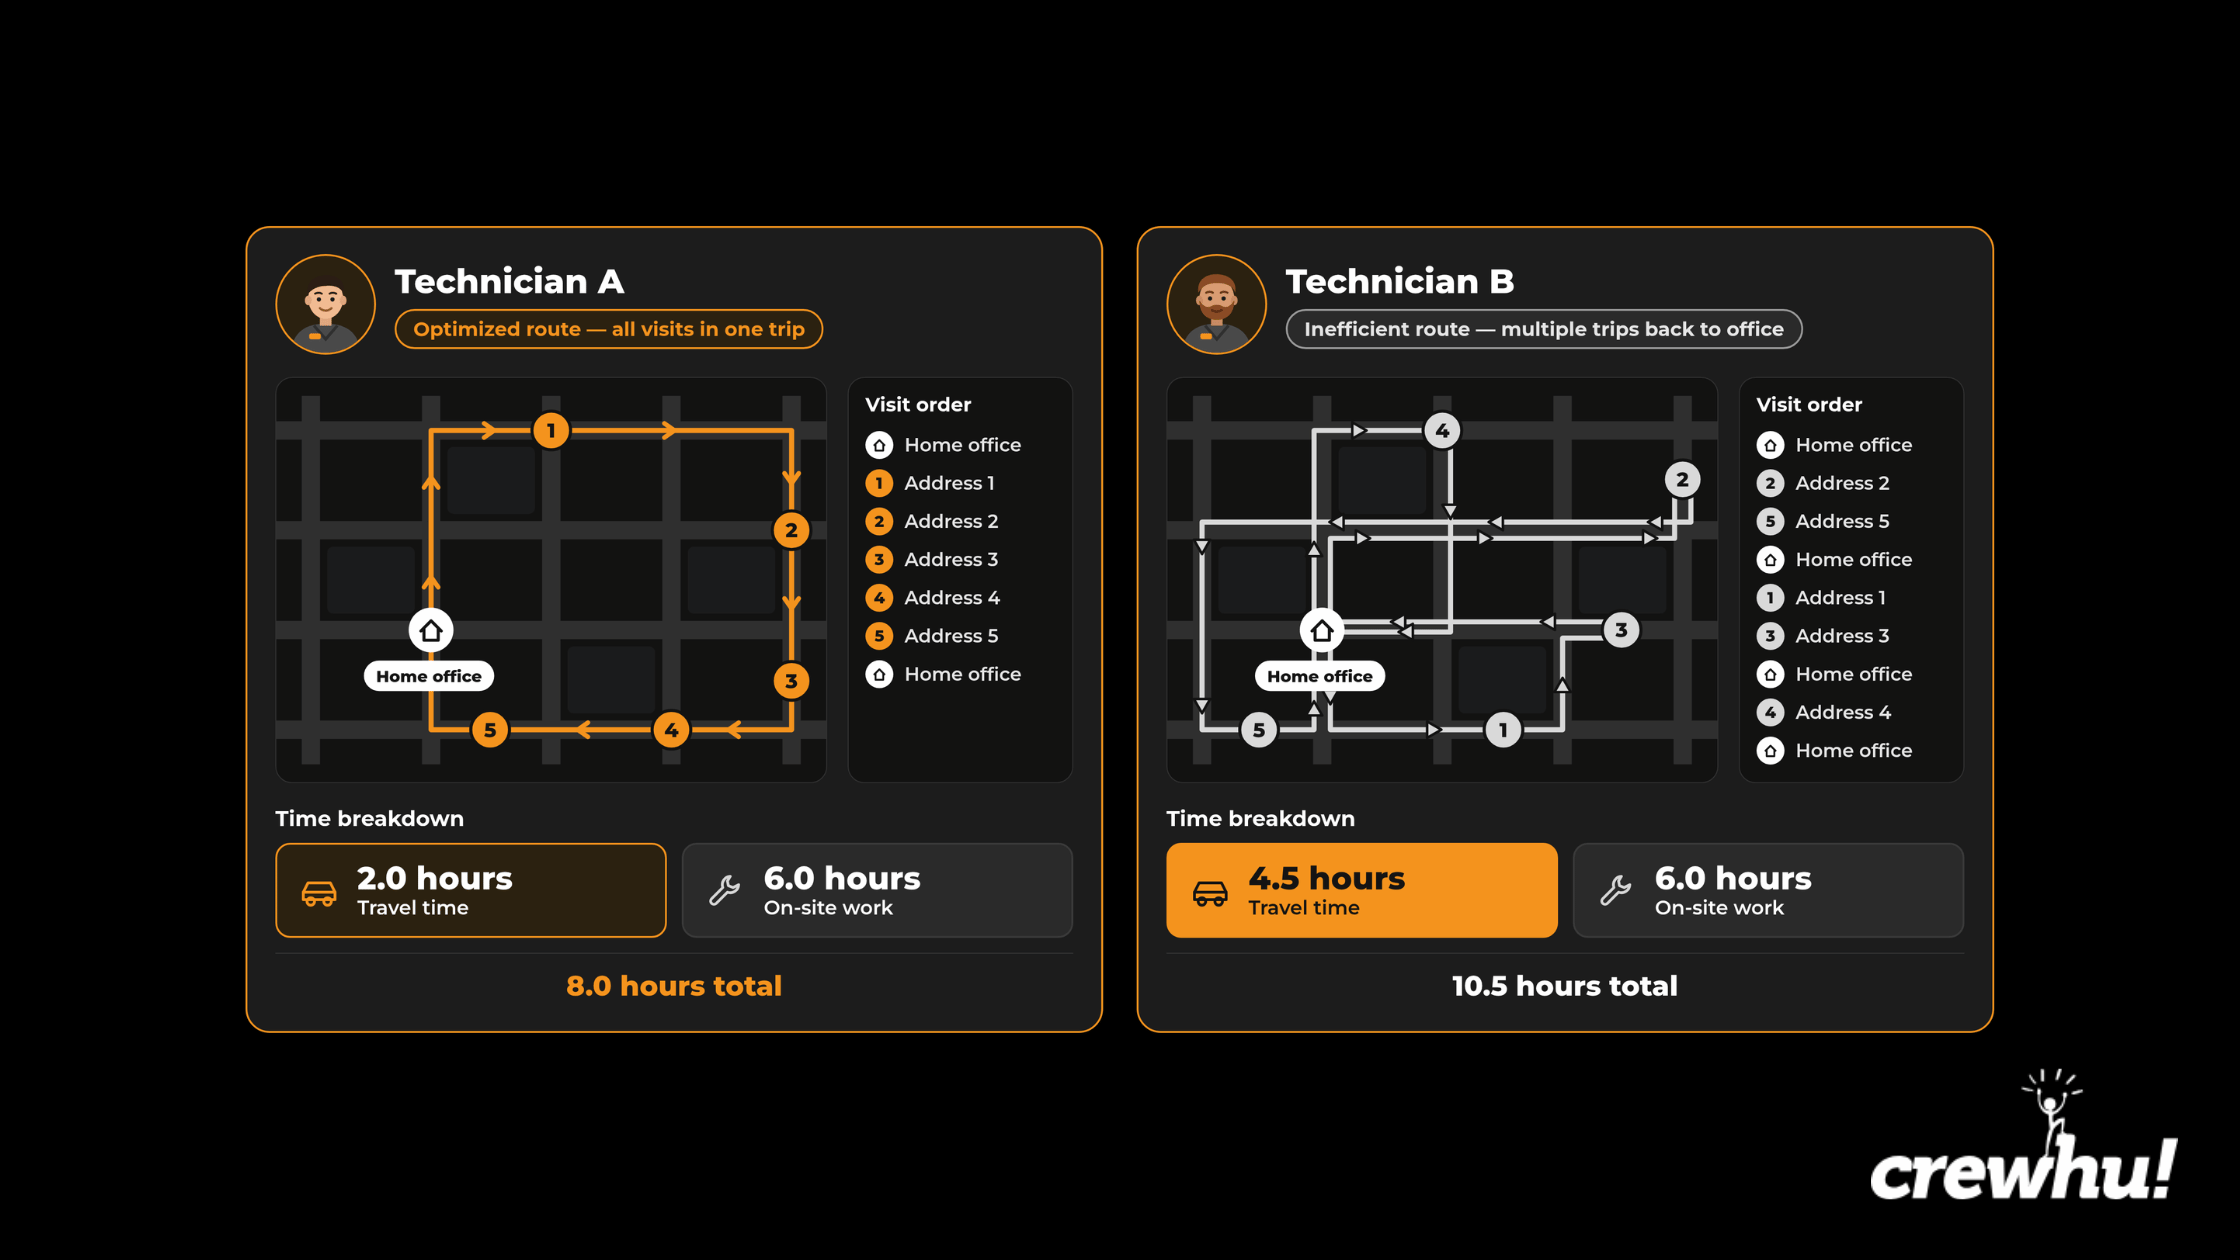
Scheduling plays a quiet, yet influential role in a technician's productivity. Two equally skilled technicians might have very different numbers of jobs simply because one has geographically clustered appointments while the other travels between distant clients. Compare jobs completed while accounting for travel time to understand what is going on.
Repeat visits aren't always evidence of poor performance either. Some jobs legitimately require multiple visits, particularly when specialized equipment, third-party access, or staged installation is involved. Be sure to separate planned follow-up visits from avoidable return visits when calculating performance.
NOC/Infrastructure and Monitoring
The NOC is the MSP's proactive layer, monitoring client infrastructure and responding to alerts and incidents (preferably before clients notice a problem). An effective NOC resolves genuine incidents quickly, filters or automates repetitive work, and prevents the same problems from returning.
Common metrics combinations: Mean time to acknowledge (MTTA), mean time to resolve (MTTR), alert volume, automation rate, escalation rate, incident recurrence, SLA compliance, and availability/uptime.
Useful metric combinations:
|
Metric combination |
What it tells you |
|
MTTA + MTTR |
If the team is both detecting/responding quickly and getting incidents resolved quickly |
|
Alert Volume + Automation Rate |
Whether increasing monitoring demand is being absorbed efficiently rather than creating equivalent manual work |
|
MTTR + Incident Recurrence |
Whether fast resolutions are fixing root causes or repeatedly treating the same symptoms |
|
Alert Volume + Escalation Rate |
Whether the NOC can handle what it detects or is pushing too much work elsewhere |
|
MTTR + Availability/Uptime |
If faster incident handling translates into less disruption for clients |
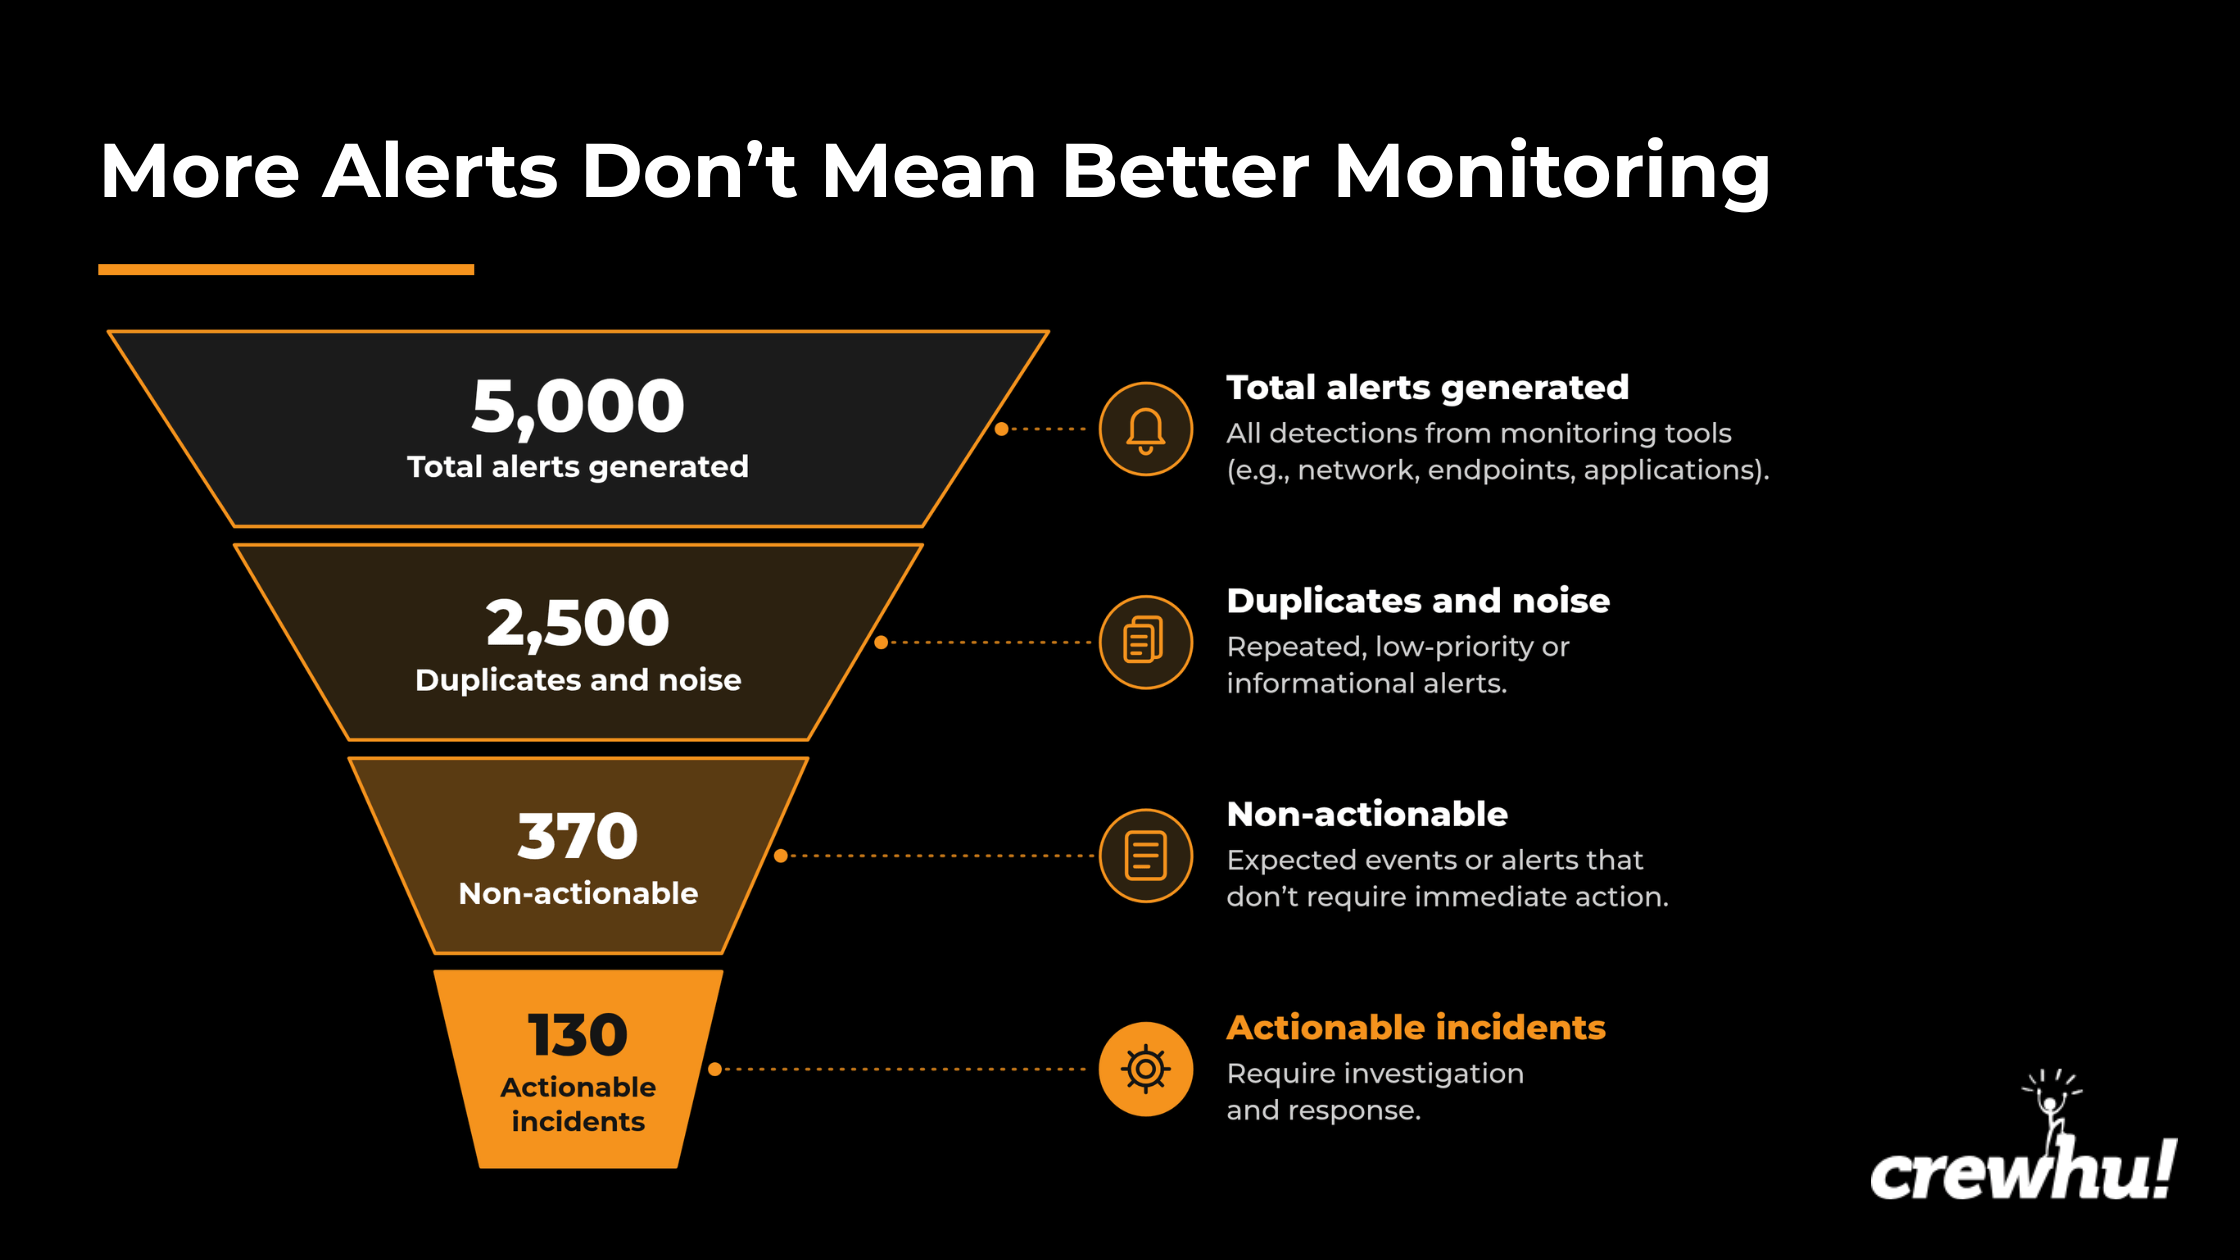
As an MSP's coverage grows, so will its alert volume. The more alerts you get, the more it becomes necessary to properly manage them. Filtering out duplicates, false positives, or low-priority notifications frees engineers to resolve genuine incidents. Examine alert volume alongside actionable-alert rates, duplicate alerts, and escalation patterns to see where tuning will pay off most.
Remember the People Behind the Metrics
It is worth remembering that metrics help you see how work is going, but they don’t tell you who your employees are. Technicians are people with limits, lives outside the job, and good and bad days, not just the sum of tickets closed and hours logged. A dashboard can show that output dipped. It can’t show that someone has been covering after-hours pages for three weeks straight.
That matters for business reasons too. Overloaded technicians get tired, and tired people make more mistakes. Those mistakes show up as reopened tickets, missed escalations, and rework, which cost more time than the work they were rushing to finish. Over time, chronic overload leads to burnout and turnover, and replacing a skilled technician is expensive.
Reducing or rebalancing workload is therefore often a productivity strategy, not a trade-off against one. Spreading tickets more evenly, automating repetitive tasks, protecting focus time, and keeping on-call rotations fair all give people room to do their best work. Rested, supported technicians resolve issues correctly the first time, and that is where lasting productivity comes from.
Turning Metrics Into Momentum
No single metric tells you whether an MSP is productive. A fast service desk may be creating rework, a low escalation rate may hide delayed handoffs, and a project delivered on time may flood the service desk with tickets weeks later. Speed and volume numbers always need a quality check beside them, and every number needs context.
Start small. Pick one struggling process, set a baseline, change one thing, and see what the numbers say after a set period. Then repeat with the next one.
Metrics only change behavior, though, when technicians can see them and know good results get noticed. That's hard when ticket data sits in the PSA, client feedback lives in a separate tool, and recognition depends on a manager remembering.
Crewhu helps close that gap. It collects client feedback after service interactions, ties it to the technicians behind it, and turns results like CSAT into recognition and rewards. Book a Crewhu demo today and see how your team could compete on work that holds up.
FAQ
What are employee productivity metrics?
Employee productivity metrics are measurable indicators of how efficiently a person or team converts time and effort into completed, valuable work. Common examples include tickets resolved per hour, first-contact resolution rate, project delivery time, and CSAT tied to individual technicians.
What's the difference between employee productivity metrics and KPIs?
Productivity metrics measure efficiency: how much output was produced relative to the time or resources invested. KPIs measure whether a specific goal was achieved, such as hitting a revenue target or an SLA percentage. The two work together but answer different questions.
Which metrics to measure employee productivity are most useful for MSPs?
For service desk teams specifically, the most useful combination is tickets resolved per technician, first-contact resolution rate, reopen rate, average handle time, and CSAT scores linked to the individual ticket and technician. Tracking these together avoids the trap of rewarding speed at the expense of quality.
How do you assess employee productivity without relying on surveillance tools?
Combine output data already generated by existing tools (PSA, RMM, calendar, survey platforms) with direct customer feedback and manager check-ins. This gives a fuller picture than activity monitoring, which tends to measure presence rather than real output, and it tends to preserve trust with the team.
How often should employee productivity measures be reviewed?
Quarterly reviews work well for most MSPs. Business size, service mix, and team structure change enough over a few months that metrics set a year ago may no longer reflect what actually matters to the business.